Immigrants from France vs Slovene Child Poverty Under the Age of 5
COMPARE
Immigrants from France
Slovene
Child Poverty Under the Age of 5
Child Poverty Under the Age of 5 Comparison
Immigrants from France
Slovenes
15.6%
CHILD POVERTY UNDER THE AGE OF 5
97.3/ 100
METRIC RATING
90th/ 347
METRIC RANK
16.0%
CHILD POVERTY UNDER THE AGE OF 5
94.4/ 100
METRIC RATING
107th/ 347
METRIC RANK
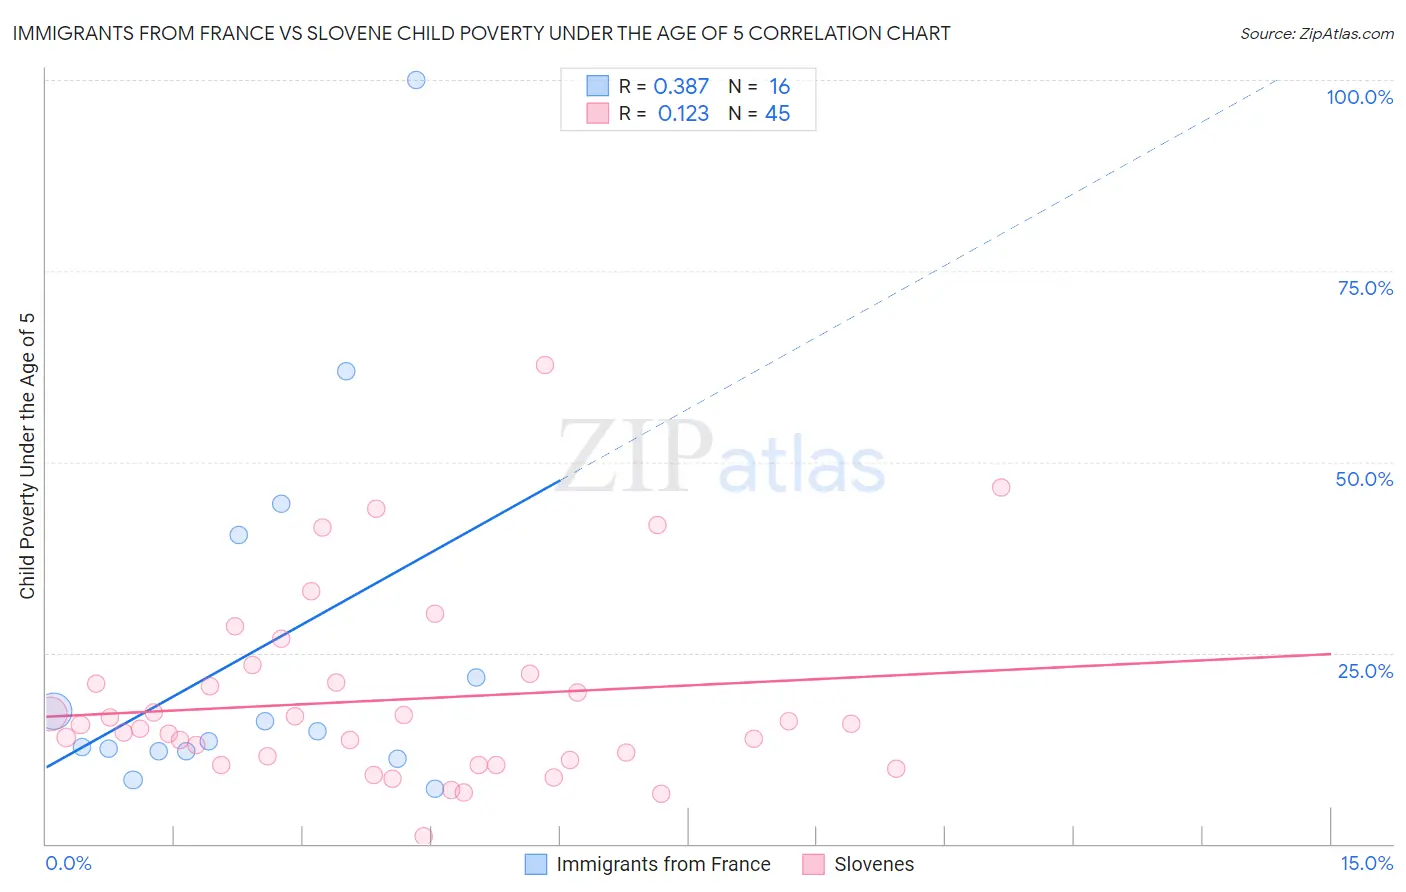
Immigrants from France vs Slovene Child Poverty Under the Age of 5 Correlation Chart
The statistical analysis conducted on geographies consisting of 277,843,690 people shows a mild positive correlation between the proportion of Immigrants from France and poverty level among children under the age of 5 in the United States with a correlation coefficient (R) of 0.387 and weighted average of 15.6%. Similarly, the statistical analysis conducted on geographies consisting of 251,690,205 people shows a poor positive correlation between the proportion of Slovenes and poverty level among children under the age of 5 in the United States with a correlation coefficient (R) of 0.123 and weighted average of 16.0%, a difference of 2.1%.
Child Poverty Under the Age of 5 Correlation Summary
| Measurement | Immigrants from France | Slovene |
| Minimum | 7.1% | 1.0% |
| Maximum | 100.0% | 62.6% |
| Range | 92.9% | 61.6% |
| Mean | 25.4% | 18.9% |
| Median | 14.0% | 15.6% |
| Interquartile 25% (IQ1) | 12.1% | 10.7% |
| Interquartile 75% (IQ3) | 31.0% | 21.7% |
| Interquartile Range (IQR) | 18.9% | 11.0% |
| Standard Deviation (Sample) | 25.1% | 12.3% |
| Standard Deviation (Population) | 24.3% | 12.2% |
Demographics Similar to Immigrants from France and Slovenes by Child Poverty Under the Age of 5
In terms of child poverty under the age of 5, the demographic groups most similar to Immigrants from France are Immigrants from Croatia (15.6%, a difference of 0.0%), Jordanian (15.6%, a difference of 0.060%), Polish (15.7%, a difference of 0.11%), Scandinavian (15.7%, a difference of 0.17%), and Ukrainian (15.7%, a difference of 0.20%). Similarly, the demographic groups most similar to Slovenes are Immigrants from Brazil (16.0%, a difference of 0.010%), Tlingit-Haida (15.9%, a difference of 0.14%), Immigrants from Spain (15.9%, a difference of 0.19%), Immigrants from North America (15.9%, a difference of 0.27%), and European (15.9%, a difference of 0.48%).
| Demographics | Rating | Rank | Child Poverty Under the Age of 5 |
| Jordanians | 97.3 /100 | #88 | Exceptional 15.6% |
| Immigrants | Croatia | 97.3 /100 | #89 | Exceptional 15.6% |
| Immigrants | France | 97.3 /100 | #90 | Exceptional 15.6% |
| Poles | 97.2 /100 | #91 | Exceptional 15.7% |
| Scandinavians | 97.1 /100 | #92 | Exceptional 15.7% |
| Ukrainians | 97.1 /100 | #93 | Exceptional 15.7% |
| Immigrants | South Eastern Asia | 97.1 /100 | #94 | Exceptional 15.7% |
| Immigrants | Switzerland | 96.4 /100 | #95 | Exceptional 15.8% |
| Immigrants | Kazakhstan | 96.2 /100 | #96 | Exceptional 15.8% |
| Macedonians | 96.2 /100 | #97 | Exceptional 15.8% |
| Immigrants | South Africa | 96.1 /100 | #98 | Exceptional 15.8% |
| Palestinians | 95.9 /100 | #99 | Exceptional 15.8% |
| Immigrants | Canada | 95.9 /100 | #100 | Exceptional 15.8% |
| Immigrants | Zimbabwe | 95.9 /100 | #101 | Exceptional 15.8% |
| Armenians | 95.7 /100 | #102 | Exceptional 15.8% |
| Europeans | 95.3 /100 | #103 | Exceptional 15.9% |
| Immigrants | North America | 94.9 /100 | #104 | Exceptional 15.9% |
| Immigrants | Spain | 94.8 /100 | #105 | Exceptional 15.9% |
| Tlingit-Haida | 94.7 /100 | #106 | Exceptional 15.9% |
| Slovenes | 94.4 /100 | #107 | Exceptional 16.0% |
| Immigrants | Brazil | 94.4 /100 | #108 | Exceptional 16.0% |