Immigrants from France vs Immigrants from Chile Male Poverty
COMPARE
Immigrants from France
Immigrants from Chile
Male Poverty
Male Poverty Comparison
Immigrants from France
Immigrants from Chile
10.9%
MALE POVERTY
75.8/ 100
METRIC RATING
141st/ 347
METRIC RANK
11.1%
MALE POVERTY
57.4/ 100
METRIC RATING
162nd/ 347
METRIC RANK
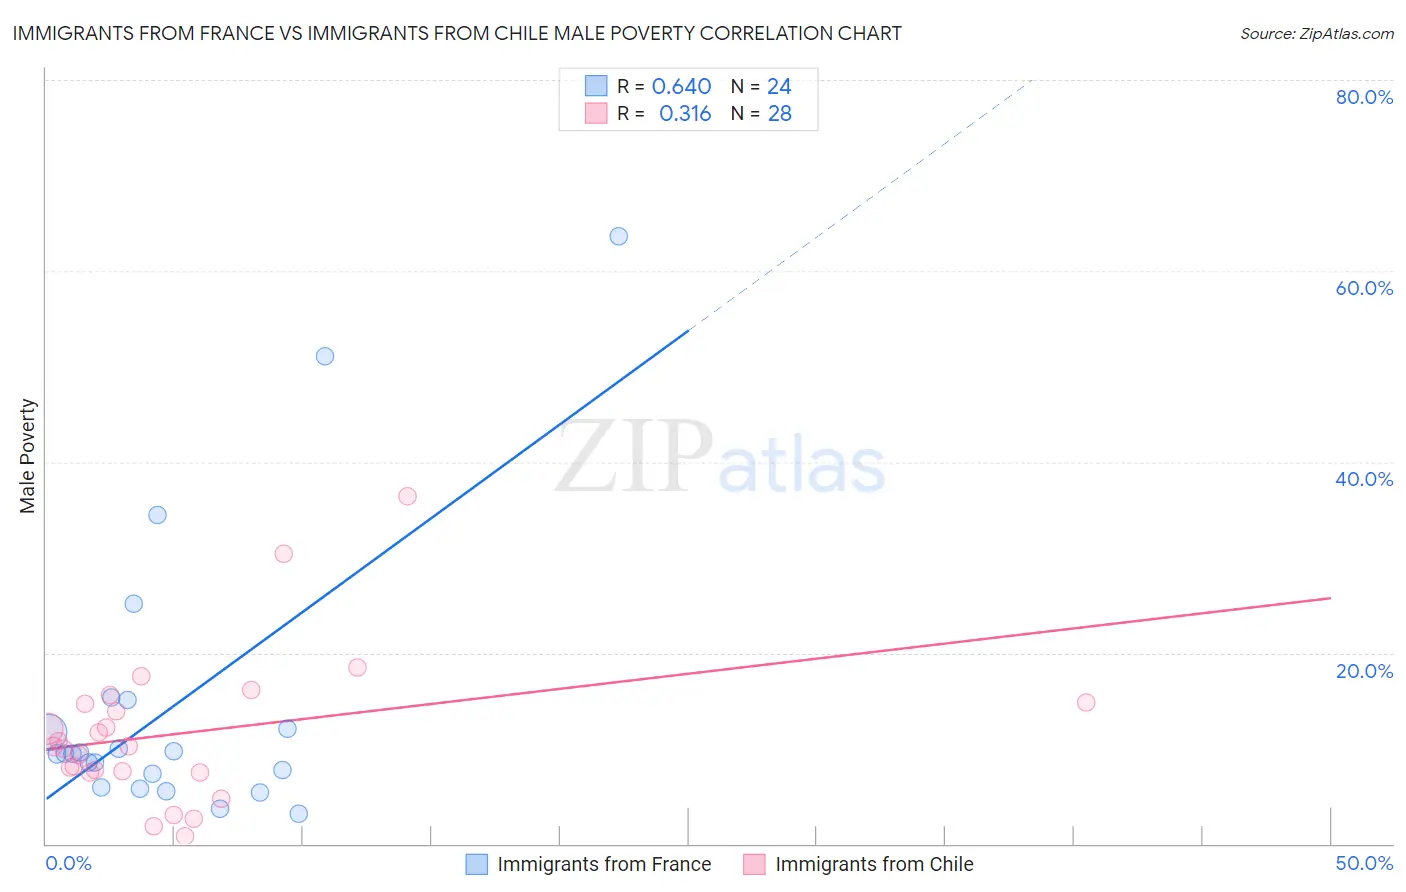
Immigrants from France vs Immigrants from Chile Male Poverty Correlation Chart
The statistical analysis conducted on geographies consisting of 287,760,426 people shows a significant positive correlation between the proportion of Immigrants from France and poverty level among males in the United States with a correlation coefficient (R) of 0.640 and weighted average of 10.9%. Similarly, the statistical analysis conducted on geographies consisting of 218,566,097 people shows a mild positive correlation between the proportion of Immigrants from Chile and poverty level among males in the United States with a correlation coefficient (R) of 0.316 and weighted average of 11.1%, a difference of 2.1%.
Male Poverty Correlation Summary
| Measurement | Immigrants from France | Immigrants from Chile |
| Minimum | 3.1% | 0.80% |
| Maximum | 63.6% | 36.4% |
| Range | 60.5% | 35.6% |
| Mean | 14.5% | 11.6% |
| Median | 9.5% | 10.2% |
| Interquartile 25% (IQ1) | 6.6% | 7.5% |
| Interquartile 75% (IQ3) | 13.6% | 14.8% |
| Interquartile Range (IQR) | 6.9% | 7.2% |
| Standard Deviation (Sample) | 15.0% | 7.8% |
| Standard Deviation (Population) | 14.7% | 7.6% |
Similar Demographics by Male Poverty
Demographics Similar to Immigrants from France by Male Poverty
In terms of male poverty, the demographic groups most similar to Immigrants from France are Tlingit-Haida (10.9%, a difference of 0.030%), Basque (10.9%, a difference of 0.17%), Immigrants from Jordan (10.8%, a difference of 0.23%), Yugoslavian (10.8%, a difference of 0.34%), and Immigrants from Switzerland (10.8%, a difference of 0.49%).
| Demographics | Rating | Rank | Male Poverty |
| New Zealanders | 82.9 /100 | #134 | Excellent 10.8% |
| Brazilians | 82.7 /100 | #135 | Excellent 10.8% |
| Immigrants | Israel | 80.9 /100 | #136 | Excellent 10.8% |
| Immigrants | Switzerland | 79.2 /100 | #137 | Good 10.8% |
| Yugoslavians | 78.2 /100 | #138 | Good 10.8% |
| Immigrants | Jordan | 77.5 /100 | #139 | Good 10.8% |
| Tlingit-Haida | 76.1 /100 | #140 | Good 10.9% |
| Immigrants | France | 75.8 /100 | #141 | Good 10.9% |
| Basques | 74.6 /100 | #142 | Good 10.9% |
| Afghans | 71.9 /100 | #143 | Good 10.9% |
| Samoans | 71.8 /100 | #144 | Good 10.9% |
| Immigrants | Germany | 71.6 /100 | #145 | Good 10.9% |
| Syrians | 71.4 /100 | #146 | Good 10.9% |
| Icelanders | 68.5 /100 | #147 | Good 11.0% |
| Armenians | 68.0 /100 | #148 | Good 11.0% |
Demographics Similar to Immigrants from Chile by Male Poverty
In terms of male poverty, the demographic groups most similar to Immigrants from Chile are White/Caucasian (11.1%, a difference of 0.060%), Ethiopian (11.1%, a difference of 0.070%), Immigrants from Spain (11.1%, a difference of 0.19%), Immigrants from Albania (11.1%, a difference of 0.21%), and Hungarian (11.1%, a difference of 0.22%).
| Demographics | Rating | Rank | Male Poverty |
| Immigrants | Malaysia | 64.7 /100 | #155 | Good 11.0% |
| Costa Ricans | 63.9 /100 | #156 | Good 11.0% |
| Scotch-Irish | 63.7 /100 | #157 | Good 11.0% |
| Colombians | 63.0 /100 | #158 | Good 11.0% |
| Taiwanese | 62.7 /100 | #159 | Good 11.0% |
| Soviet Union | 60.3 /100 | #160 | Good 11.1% |
| Immigrants | Northern Africa | 59.7 /100 | #161 | Average 11.1% |
| Immigrants | Chile | 57.4 /100 | #162 | Average 11.1% |
| Whites/Caucasians | 56.7 /100 | #163 | Average 11.1% |
| Ethiopians | 56.7 /100 | #164 | Average 11.1% |
| Immigrants | Spain | 55.5 /100 | #165 | Average 11.1% |
| Immigrants | Albania | 55.3 /100 | #166 | Average 11.1% |
| Hungarians | 55.1 /100 | #167 | Average 11.1% |
| Immigrants | Portugal | 54.9 /100 | #168 | Average 11.1% |
| Immigrants | Colombia | 54.2 /100 | #169 | Average 11.1% |