Immigrants from Europe vs Ugandan Female Poverty
COMPARE
Immigrants from Europe
Ugandan
Female Poverty
Female Poverty Comparison
Immigrants from Europe
Ugandans
12.1%
FEMALE POVERTY
98.2/ 100
METRIC RATING
59th/ 347
METRIC RANK
14.0%
FEMALE POVERTY
15.4/ 100
METRIC RATING
205th/ 347
METRIC RANK
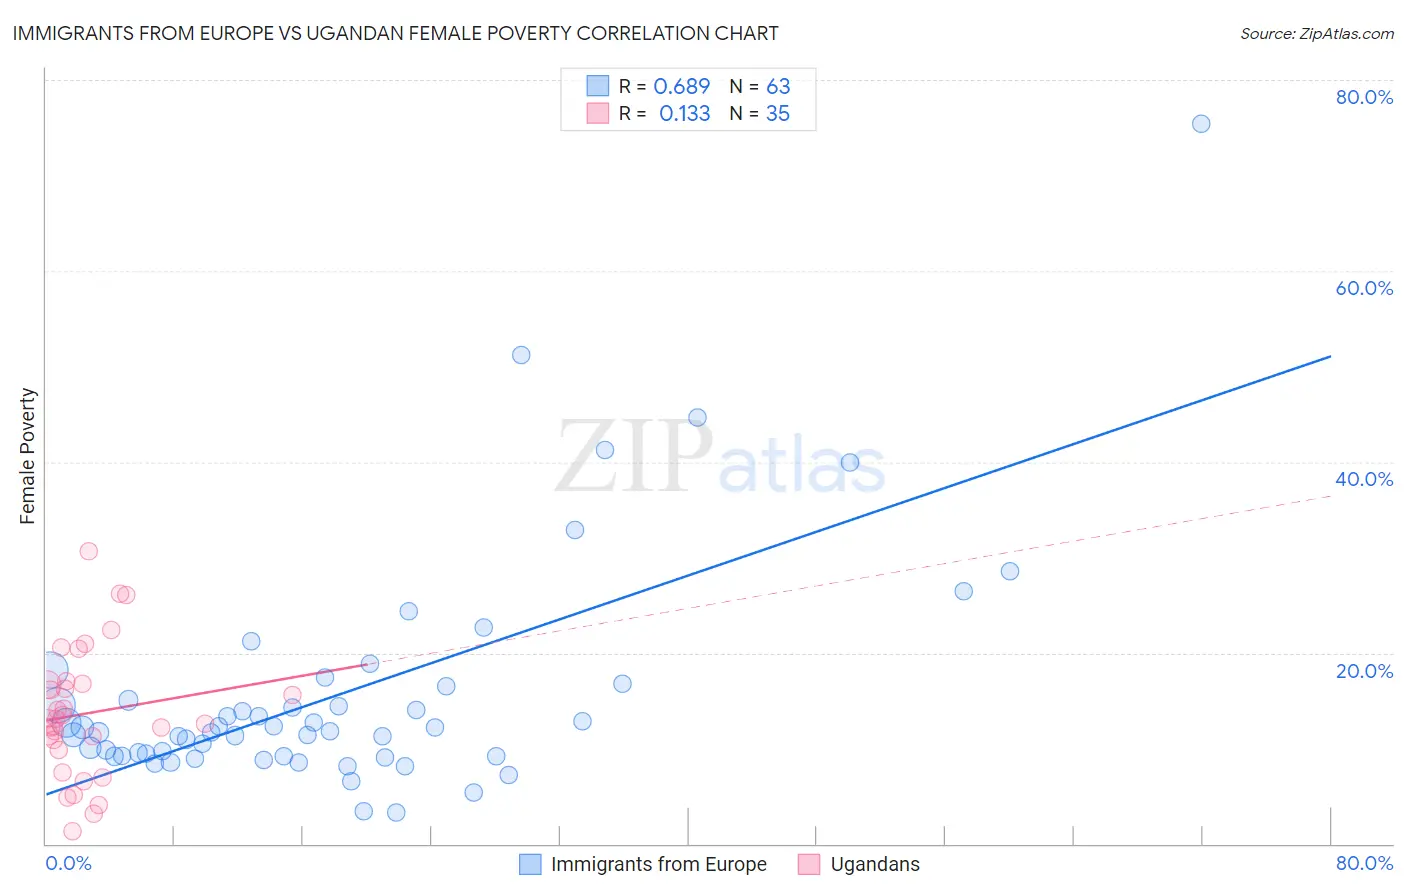
Immigrants from Europe vs Ugandan Female Poverty Correlation Chart
The statistical analysis conducted on geographies consisting of 546,481,201 people shows a significant positive correlation between the proportion of Immigrants from Europe and poverty level among females in the United States with a correlation coefficient (R) of 0.689 and weighted average of 12.1%. Similarly, the statistical analysis conducted on geographies consisting of 93,995,237 people shows a poor positive correlation between the proportion of Ugandans and poverty level among females in the United States with a correlation coefficient (R) of 0.133 and weighted average of 14.0%, a difference of 15.2%.
Female Poverty Correlation Summary
| Measurement | Immigrants from Europe | Ugandan |
| Minimum | 3.3% | 1.3% |
| Maximum | 75.4% | 30.6% |
| Range | 72.1% | 29.3% |
| Mean | 15.7% | 13.6% |
| Median | 11.8% | 13.1% |
| Interquartile 25% (IQ1) | 9.2% | 9.8% |
| Interquartile 75% (IQ3) | 16.5% | 16.8% |
| Interquartile Range (IQR) | 7.3% | 7.0% |
| Standard Deviation (Sample) | 12.2% | 6.8% |
| Standard Deviation (Population) | 12.1% | 6.7% |
Similar Demographics by Female Poverty
Demographics Similar to Immigrants from Europe by Female Poverty
In terms of female poverty, the demographic groups most similar to Immigrants from Europe are Scandinavian (12.1%, a difference of 0.010%), Immigrants from Serbia (12.1%, a difference of 0.090%), Estonian (12.1%, a difference of 0.15%), Immigrants from Australia (12.2%, a difference of 0.24%), and Immigrants from Asia (12.2%, a difference of 0.25%).
| Demographics | Rating | Rank | Female Poverty |
| Immigrants | Croatia | 98.7 /100 | #52 | Exceptional 12.0% |
| Immigrants | Austria | 98.7 /100 | #53 | Exceptional 12.0% |
| Immigrants | Philippines | 98.7 /100 | #54 | Exceptional 12.1% |
| Immigrants | Sri Lanka | 98.5 /100 | #55 | Exceptional 12.1% |
| Estonians | 98.3 /100 | #56 | Exceptional 12.1% |
| Immigrants | Serbia | 98.3 /100 | #57 | Exceptional 12.1% |
| Scandinavians | 98.2 /100 | #58 | Exceptional 12.1% |
| Immigrants | Europe | 98.2 /100 | #59 | Exceptional 12.1% |
| Immigrants | Australia | 98.1 /100 | #60 | Exceptional 12.2% |
| Immigrants | Asia | 98.1 /100 | #61 | Exceptional 12.2% |
| Immigrants | Italy | 98.0 /100 | #62 | Exceptional 12.2% |
| Ukrainians | 98.0 /100 | #63 | Exceptional 12.2% |
| Germans | 98.0 /100 | #64 | Exceptional 12.2% |
| Indians (Asian) | 97.9 /100 | #65 | Exceptional 12.2% |
| Austrians | 97.9 /100 | #66 | Exceptional 12.2% |
Demographics Similar to Ugandans by Female Poverty
In terms of female poverty, the demographic groups most similar to Ugandans are Immigrants from Uruguay (14.0%, a difference of 0.27%), Spaniard (13.9%, a difference of 0.56%), Immigrants from Western Asia (13.9%, a difference of 0.84%), Hmong (13.9%, a difference of 0.89%), and Immigrants from Kenya (13.9%, a difference of 0.90%).
| Demographics | Rating | Rank | Female Poverty |
| Immigrants | Uganda | 28.5 /100 | #198 | Fair 13.7% |
| Immigrants | Lebanon | 25.6 /100 | #199 | Fair 13.8% |
| Spanish | 21.4 /100 | #200 | Fair 13.9% |
| Immigrants | Kenya | 21.1 /100 | #201 | Fair 13.9% |
| Hmong | 21.1 /100 | #202 | Fair 13.9% |
| Immigrants | Western Asia | 20.7 /100 | #203 | Fair 13.9% |
| Spaniards | 18.9 /100 | #204 | Poor 13.9% |
| Ugandans | 15.4 /100 | #205 | Poor 14.0% |
| Immigrants | Uruguay | 14.0 /100 | #206 | Poor 14.0% |
| Immigrants | Eastern Africa | 9.0 /100 | #207 | Tragic 14.2% |
| Immigrants | Azores | 7.9 /100 | #208 | Tragic 14.2% |
| Panamanians | 7.7 /100 | #209 | Tragic 14.2% |
| Malaysians | 7.4 /100 | #210 | Tragic 14.3% |
| Moroccans | 7.2 /100 | #211 | Tragic 14.3% |
| Bermudans | 5.5 /100 | #212 | Tragic 14.4% |