Immigrants from Ethiopia vs Native/Alaskan Male Poverty
COMPARE
Immigrants from Ethiopia
Native/Alaskan
Male Poverty
Male Poverty Comparison
Immigrants from Ethiopia
Natives/Alaskans
11.2%
MALE POVERTY
50.7/ 100
METRIC RATING
172nd/ 347
METRIC RANK
16.9%
MALE POVERTY
0.0/ 100
METRIC RATING
333rd/ 347
METRIC RANK
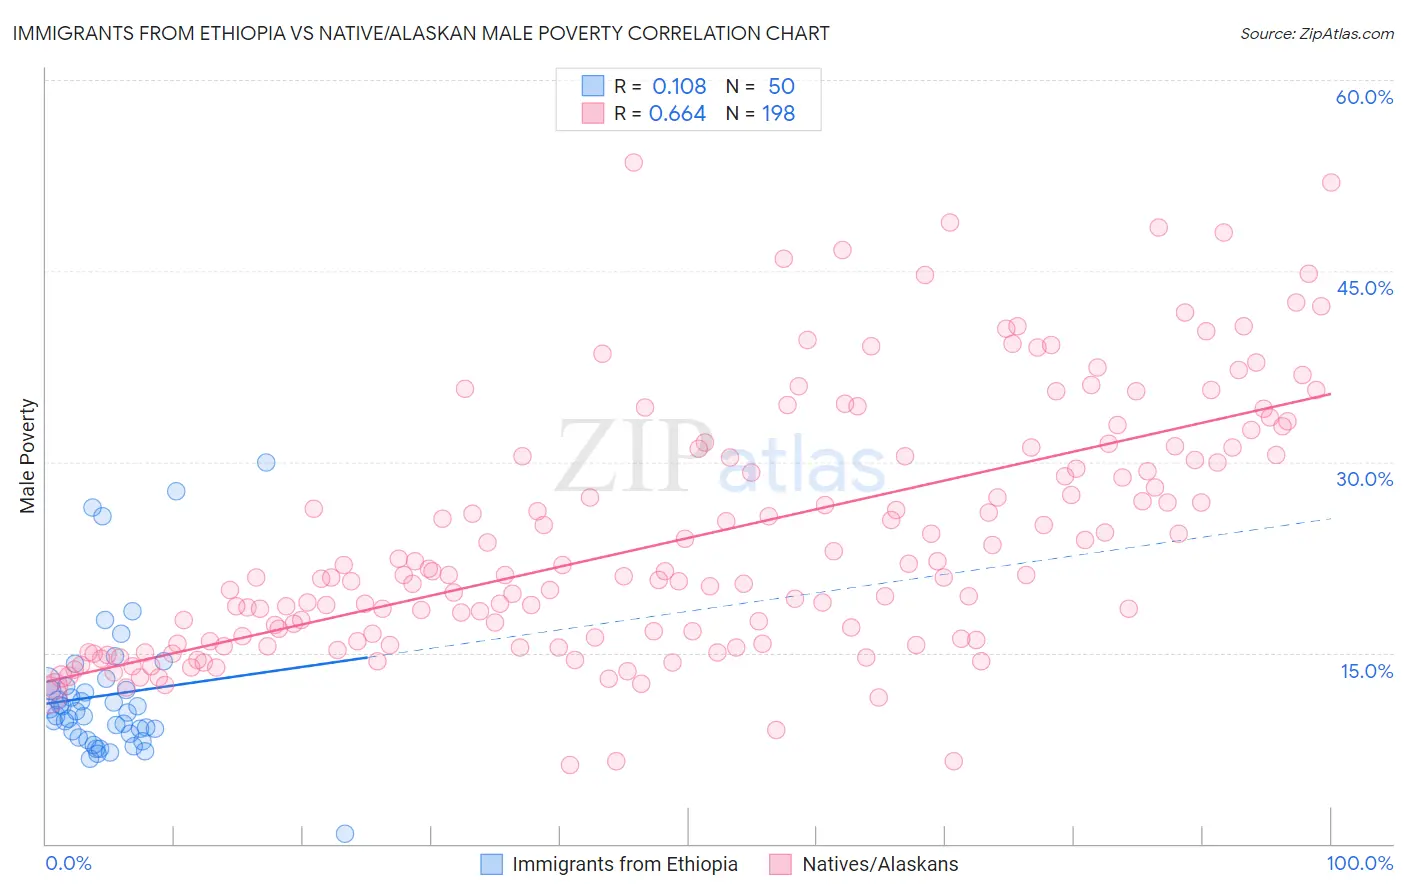
Immigrants from Ethiopia vs Native/Alaskan Male Poverty Correlation Chart
The statistical analysis conducted on geographies consisting of 211,452,093 people shows a poor positive correlation between the proportion of Immigrants from Ethiopia and poverty level among males in the United States with a correlation coefficient (R) of 0.108 and weighted average of 11.2%. Similarly, the statistical analysis conducted on geographies consisting of 512,413,000 people shows a significant positive correlation between the proportion of Natives/Alaskans and poverty level among males in the United States with a correlation coefficient (R) of 0.664 and weighted average of 16.9%, a difference of 51.4%.
Male Poverty Correlation Summary
| Measurement | Immigrants from Ethiopia | Native/Alaskan |
| Minimum | 0.81% | 6.2% |
| Maximum | 30.0% | 53.5% |
| Range | 29.2% | 47.3% |
| Mean | 11.7% | 24.0% |
| Median | 10.3% | 21.1% |
| Interquartile 25% (IQ1) | 8.7% | 16.0% |
| Interquartile 75% (IQ3) | 12.4% | 30.5% |
| Interquartile Range (IQR) | 3.7% | 14.6% |
| Standard Deviation (Sample) | 5.6% | 9.9% |
| Standard Deviation (Population) | 5.5% | 9.9% |
Similar Demographics by Male Poverty
Demographics Similar to Immigrants from Ethiopia by Male Poverty
In terms of male poverty, the demographic groups most similar to Immigrants from Ethiopia are Pennsylvania German (11.2%, a difference of 0.020%), Uruguayan (11.2%, a difference of 0.040%), Immigrants from Oceania (11.2%, a difference of 0.070%), South American (11.1%, a difference of 0.30%), and Celtic (11.2%, a difference of 0.32%).
| Demographics | Rating | Rank | Male Poverty |
| Immigrants | Spain | 55.5 /100 | #165 | Average 11.1% |
| Immigrants | Albania | 55.3 /100 | #166 | Average 11.1% |
| Hungarians | 55.1 /100 | #167 | Average 11.1% |
| Immigrants | Portugal | 54.9 /100 | #168 | Average 11.1% |
| Immigrants | Colombia | 54.2 /100 | #169 | Average 11.1% |
| South Americans | 53.8 /100 | #170 | Average 11.1% |
| Uruguayans | 51.0 /100 | #171 | Average 11.2% |
| Immigrants | Ethiopia | 50.7 /100 | #172 | Average 11.2% |
| Pennsylvania Germans | 50.5 /100 | #173 | Average 11.2% |
| Immigrants | Oceania | 50.0 /100 | #174 | Average 11.2% |
| Celtics | 47.5 /100 | #175 | Average 11.2% |
| Immigrants | Fiji | 46.0 /100 | #176 | Average 11.2% |
| Lebanese | 45.6 /100 | #177 | Average 11.2% |
| Immigrants | Cameroon | 44.5 /100 | #178 | Average 11.2% |
| Immigrants | Syria | 40.3 /100 | #179 | Average 11.3% |
Demographics Similar to Natives/Alaskans by Male Poverty
In terms of male poverty, the demographic groups most similar to Natives/Alaskans are Houma (16.7%, a difference of 1.2%), Cheyenne (17.6%, a difference of 4.2%), Ute (16.2%, a difference of 4.2%), Apache (17.7%, a difference of 4.4%), and Immigrants from Dominican Republic (16.2%, a difference of 4.6%).
| Demographics | Rating | Rank | Male Poverty |
| Central American Indians | 0.0 /100 | #326 | Tragic 15.3% |
| Paiute | 0.0 /100 | #327 | Tragic 15.8% |
| Blacks/African Americans | 0.0 /100 | #328 | Tragic 15.8% |
| Dominicans | 0.0 /100 | #329 | Tragic 16.1% |
| Immigrants | Dominican Republic | 0.0 /100 | #330 | Tragic 16.2% |
| Ute | 0.0 /100 | #331 | Tragic 16.2% |
| Houma | 0.0 /100 | #332 | Tragic 16.7% |
| Natives/Alaskans | 0.0 /100 | #333 | Tragic 16.9% |
| Cheyenne | 0.0 /100 | #334 | Tragic 17.6% |
| Apache | 0.0 /100 | #335 | Tragic 17.7% |
| Pueblo | 0.0 /100 | #336 | Tragic 18.5% |
| Sioux | 0.0 /100 | #337 | Tragic 18.7% |
| Crow | 0.0 /100 | #338 | Tragic 19.1% |
| Yuman | 0.0 /100 | #339 | Tragic 19.5% |
| Immigrants | Yemen | 0.0 /100 | #340 | Tragic 20.1% |