Immigrants from England vs Immigrants from Cuba Poverty
COMPARE
Immigrants from England
Immigrants from Cuba
Poverty
Poverty Comparison
Immigrants from England
Immigrants from Cuba
11.4%
POVERTY
96.2/ 100
METRIC RATING
85th/ 347
METRIC RANK
14.6%
POVERTY
0.1/ 100
METRIC RATING
269th/ 347
METRIC RANK
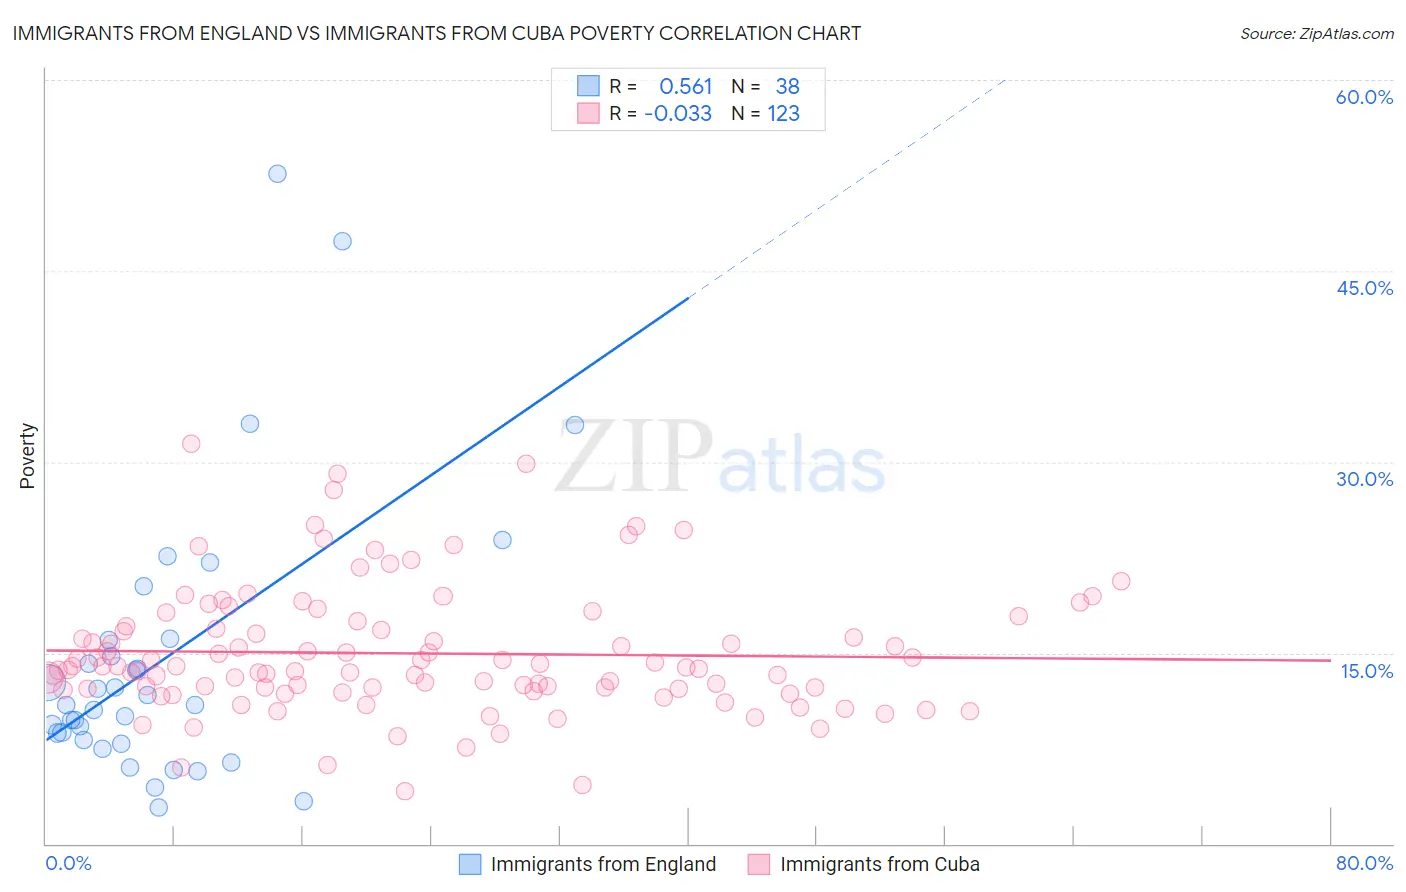
Immigrants from England vs Immigrants from Cuba Poverty Correlation Chart
The statistical analysis conducted on geographies consisting of 391,749,071 people shows a substantial positive correlation between the proportion of Immigrants from England and poverty level in the United States with a correlation coefficient (R) of 0.561 and weighted average of 11.4%. Similarly, the statistical analysis conducted on geographies consisting of 325,967,480 people shows no correlation between the proportion of Immigrants from Cuba and poverty level in the United States with a correlation coefficient (R) of -0.033 and weighted average of 14.6%, a difference of 28.2%.
Poverty Correlation Summary
| Measurement | Immigrants from England | Immigrants from Cuba |
| Minimum | 2.8% | 4.1% |
| Maximum | 52.7% | 31.4% |
| Range | 49.8% | 27.3% |
| Mean | 14.4% | 15.0% |
| Median | 10.9% | 13.9% |
| Interquartile 25% (IQ1) | 8.2% | 12.2% |
| Interquartile 75% (IQ3) | 16.0% | 17.1% |
| Interquartile Range (IQR) | 7.8% | 4.9% |
| Standard Deviation (Sample) | 11.0% | 5.0% |
| Standard Deviation (Population) | 10.9% | 5.0% |
Similar Demographics by Poverty
Demographics Similar to Immigrants from England by Poverty
In terms of poverty, the demographic groups most similar to Immigrants from England are English (11.3%, a difference of 0.070%), Immigrants from Sweden (11.3%, a difference of 0.080%), Jordanian (11.4%, a difference of 0.12%), Northern European (11.4%, a difference of 0.12%), and Egyptian (11.3%, a difference of 0.25%).
| Demographics | Rating | Rank | Poverty |
| Dutch | 96.7 /100 | #78 | Exceptional 11.3% |
| Cambodians | 96.7 /100 | #79 | Exceptional 11.3% |
| Indians (Asian) | 96.6 /100 | #80 | Exceptional 11.3% |
| Irish | 96.6 /100 | #81 | Exceptional 11.3% |
| Egyptians | 96.5 /100 | #82 | Exceptional 11.3% |
| Immigrants | Sweden | 96.3 /100 | #83 | Exceptional 11.3% |
| English | 96.3 /100 | #84 | Exceptional 11.3% |
| Immigrants | England | 96.2 /100 | #85 | Exceptional 11.4% |
| Jordanians | 96.0 /100 | #86 | Exceptional 11.4% |
| Northern Europeans | 96.0 /100 | #87 | Exceptional 11.4% |
| Belgians | 95.8 /100 | #88 | Exceptional 11.4% |
| Czechoslovakians | 95.7 /100 | #89 | Exceptional 11.4% |
| Immigrants | Denmark | 95.5 /100 | #90 | Exceptional 11.4% |
| Finns | 95.2 /100 | #91 | Exceptional 11.4% |
| British | 95.0 /100 | #92 | Exceptional 11.4% |
Demographics Similar to Immigrants from Cuba by Poverty
In terms of poverty, the demographic groups most similar to Immigrants from Cuba are Central American (14.6%, a difference of 0.14%), Subsaharan African (14.5%, a difference of 0.15%), Iroquois (14.5%, a difference of 0.19%), Guyanese (14.5%, a difference of 0.51%), and Immigrants from Guyana (14.5%, a difference of 0.68%).
| Demographics | Rating | Rank | Poverty |
| Immigrants | Liberia | 0.1 /100 | #262 | Tragic 14.4% |
| Jamaicans | 0.1 /100 | #263 | Tragic 14.4% |
| Immigrants | Jamaica | 0.1 /100 | #264 | Tragic 14.4% |
| Immigrants | Guyana | 0.1 /100 | #265 | Tragic 14.5% |
| Guyanese | 0.1 /100 | #266 | Tragic 14.5% |
| Iroquois | 0.1 /100 | #267 | Tragic 14.5% |
| Sub-Saharan Africans | 0.1 /100 | #268 | Tragic 14.5% |
| Immigrants | Cuba | 0.1 /100 | #269 | Tragic 14.6% |
| Central Americans | 0.1 /100 | #270 | Tragic 14.6% |
| Shoshone | 0.0 /100 | #271 | Tragic 14.7% |
| Chickasaw | 0.0 /100 | #272 | Tragic 14.7% |
| Spanish Americans | 0.0 /100 | #273 | Tragic 14.7% |
| Barbadians | 0.0 /100 | #274 | Tragic 14.8% |
| Immigrants | West Indies | 0.0 /100 | #275 | Tragic 14.8% |
| Immigrants | Bahamas | 0.0 /100 | #276 | Tragic 14.8% |