Immigrants from England vs Immigrants from Cambodia Female Poverty Among 18-24 Year Olds
COMPARE
Immigrants from England
Immigrants from Cambodia
Female Poverty Among 18-24 Year Olds
Female Poverty Among 18-24 Year Olds Comparison
Immigrants from England
Immigrants from Cambodia
19.5%
FEMALE POVERTY AMONG 18-24 YEAR OLDS
92.9/ 100
METRIC RATING
129th/ 347
METRIC RANK
18.8%
FEMALE POVERTY AMONG 18-24 YEAR OLDS
99.5/ 100
METRIC RATING
76th/ 347
METRIC RANK
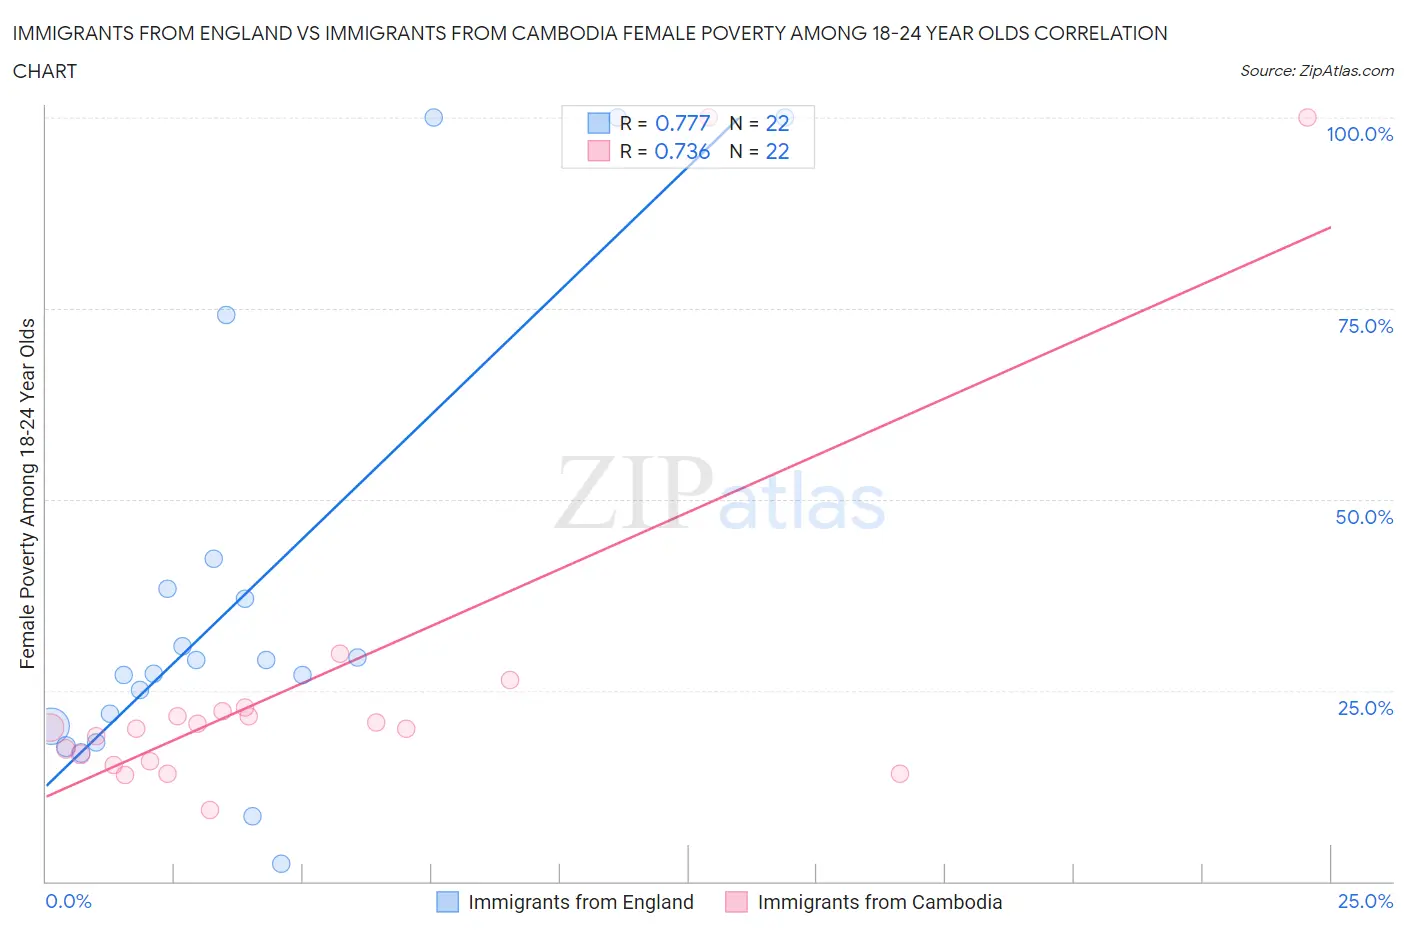
Immigrants from England vs Immigrants from Cambodia Female Poverty Among 18-24 Year Olds Correlation Chart
The statistical analysis conducted on geographies consisting of 380,023,183 people shows a strong positive correlation between the proportion of Immigrants from England and poverty level among females between the ages 18 and 24 in the United States with a correlation coefficient (R) of 0.777 and weighted average of 19.5%. Similarly, the statistical analysis conducted on geographies consisting of 203,303,935 people shows a strong positive correlation between the proportion of Immigrants from Cambodia and poverty level among females between the ages 18 and 24 in the United States with a correlation coefficient (R) of 0.736 and weighted average of 18.8%, a difference of 3.7%.
Female Poverty Among 18-24 Year Olds Correlation Summary
| Measurement | Immigrants from England | Immigrants from Cambodia |
| Minimum | 2.2% | 9.3% |
| Maximum | 100.0% | 100.0% |
| Range | 97.8% | 90.7% |
| Mean | 37.3% | 26.4% |
| Median | 28.1% | 20.1% |
| Interquartile 25% (IQ1) | 20.3% | 15.8% |
| Interquartile 75% (IQ3) | 38.2% | 22.2% |
| Interquartile Range (IQR) | 18.0% | 6.4% |
| Standard Deviation (Sample) | 29.0% | 24.2% |
| Standard Deviation (Population) | 28.3% | 23.7% |
Similar Demographics by Female Poverty Among 18-24 Year Olds
Demographics Similar to Immigrants from England by Female Poverty Among 18-24 Year Olds
In terms of female poverty among 18-24 year olds, the demographic groups most similar to Immigrants from England are Slovak (19.5%, a difference of 0.0%), Immigrants from Canada (19.5%, a difference of 0.0%), Latvian (19.5%, a difference of 0.040%), Cape Verdean (19.4%, a difference of 0.14%), and Jamaican (19.5%, a difference of 0.15%).
| Demographics | Rating | Rank | Female Poverty Among 18-24 Year Olds |
| Cambodians | 94.6 /100 | #122 | Exceptional 19.4% |
| Paraguayans | 94.6 /100 | #123 | Exceptional 19.4% |
| Immigrants | Chile | 94.3 /100 | #124 | Exceptional 19.4% |
| Immigrants | Panama | 94.0 /100 | #125 | Exceptional 19.4% |
| Immigrants | Russia | 93.7 /100 | #126 | Exceptional 19.4% |
| Cape Verdeans | 93.6 /100 | #127 | Exceptional 19.4% |
| Slovaks | 92.9 /100 | #128 | Exceptional 19.5% |
| Immigrants | England | 92.9 /100 | #129 | Exceptional 19.5% |
| Immigrants | Canada | 92.9 /100 | #130 | Exceptional 19.5% |
| Latvians | 92.7 /100 | #131 | Exceptional 19.5% |
| Jamaicans | 92.1 /100 | #132 | Exceptional 19.5% |
| Turks | 92.1 /100 | #133 | Exceptional 19.5% |
| Immigrants | North America | 92.1 /100 | #134 | Exceptional 19.5% |
| Soviet Union | 92.0 /100 | #135 | Exceptional 19.5% |
| Russians | 91.5 /100 | #136 | Exceptional 19.5% |
Demographics Similar to Immigrants from Cambodia by Female Poverty Among 18-24 Year Olds
In terms of female poverty among 18-24 year olds, the demographic groups most similar to Immigrants from Cambodia are Polish (18.8%, a difference of 0.080%), Costa Rican (18.8%, a difference of 0.10%), Immigrants from Europe (18.8%, a difference of 0.11%), Uruguayan (18.8%, a difference of 0.11%), and Palestinian (18.8%, a difference of 0.19%).
| Demographics | Rating | Rank | Female Poverty Among 18-24 Year Olds |
| Immigrants | Bulgaria | 99.7 /100 | #69 | Exceptional 18.6% |
| Immigrants | Costa Rica | 99.7 /100 | #70 | Exceptional 18.7% |
| Immigrants | Haiti | 99.7 /100 | #71 | Exceptional 18.7% |
| Armenians | 99.7 /100 | #72 | Exceptional 18.7% |
| Lithuanians | 99.7 /100 | #73 | Exceptional 18.7% |
| Hawaiians | 99.6 /100 | #74 | Exceptional 18.7% |
| Poles | 99.6 /100 | #75 | Exceptional 18.8% |
| Immigrants | Cambodia | 99.5 /100 | #76 | Exceptional 18.8% |
| Costa Ricans | 99.5 /100 | #77 | Exceptional 18.8% |
| Immigrants | Europe | 99.5 /100 | #78 | Exceptional 18.8% |
| Uruguayans | 99.5 /100 | #79 | Exceptional 18.8% |
| Palestinians | 99.5 /100 | #80 | Exceptional 18.8% |
| Japanese | 99.5 /100 | #81 | Exceptional 18.8% |
| Immigrants | Uruguay | 99.4 /100 | #82 | Exceptional 18.8% |
| Immigrants | Indonesia | 99.4 /100 | #83 | Exceptional 18.9% |