Immigrants from El Salvador vs Pennsylvania German Single Mother Poverty
COMPARE
Immigrants from El Salvador
Pennsylvania German
Single Mother Poverty
Single Mother Poverty Comparison
Immigrants from El Salvador
Pennsylvania Germans
31.2%
SINGLE MOTHER POVERTY
0.3/ 100
METRIC RATING
261st/ 347
METRIC RANK
33.2%
SINGLE MOTHER POVERTY
0.0/ 100
METRIC RATING
297th/ 347
METRIC RANK
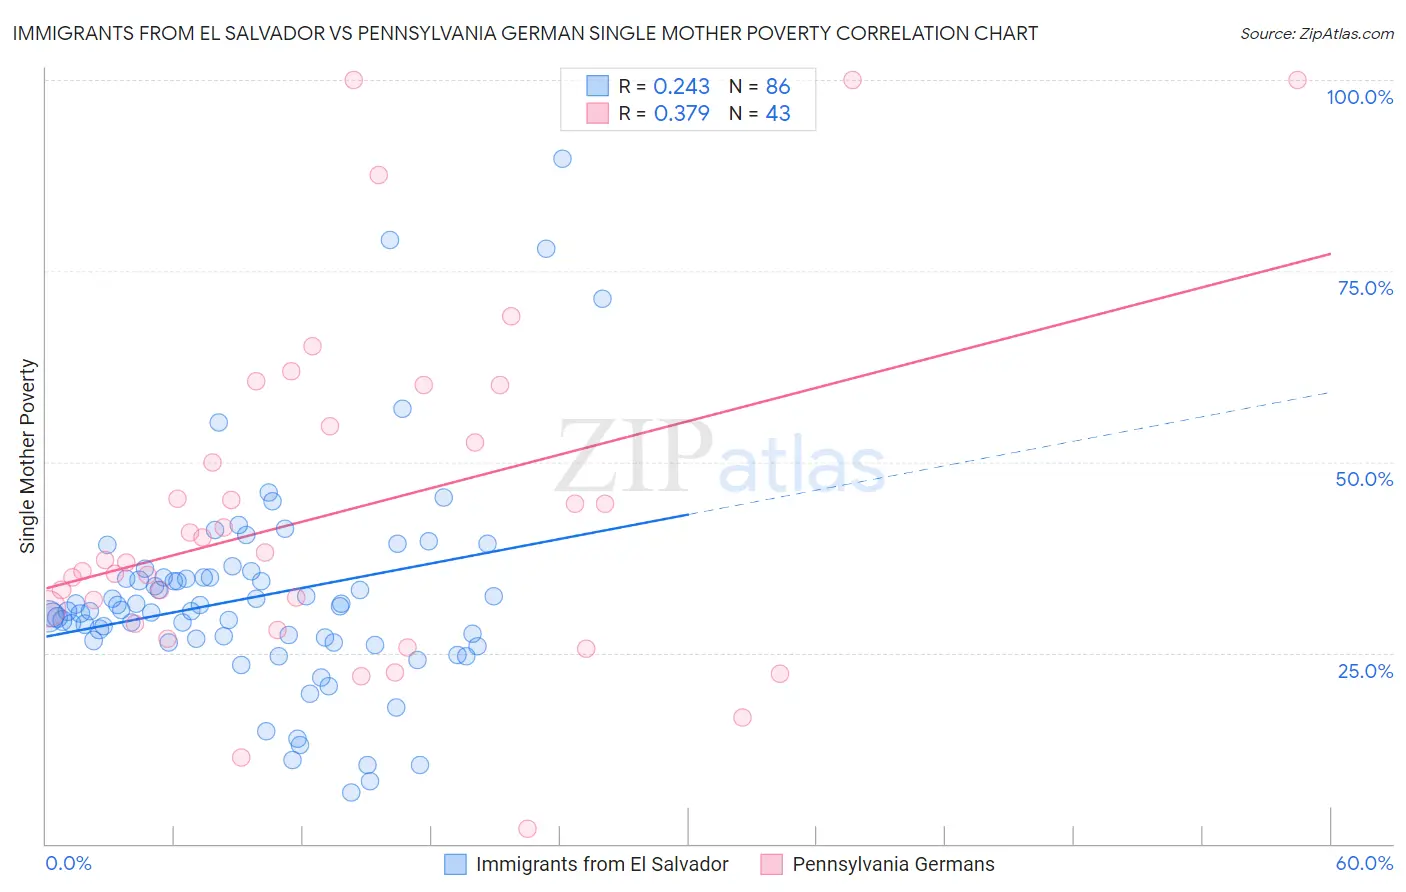
Immigrants from El Salvador vs Pennsylvania German Single Mother Poverty Correlation Chart
The statistical analysis conducted on geographies consisting of 352,610,814 people shows a weak positive correlation between the proportion of Immigrants from El Salvador and poverty level among single mothers in the United States with a correlation coefficient (R) of 0.243 and weighted average of 31.2%. Similarly, the statistical analysis conducted on geographies consisting of 229,321,350 people shows a mild positive correlation between the proportion of Pennsylvania Germans and poverty level among single mothers in the United States with a correlation coefficient (R) of 0.379 and weighted average of 33.2%, a difference of 6.5%.
Single Mother Poverty Correlation Summary
| Measurement | Immigrants from El Salvador | Pennsylvania German |
| Minimum | 6.7% | 1.9% |
| Maximum | 89.6% | 100.0% |
| Range | 83.0% | 98.1% |
| Mean | 32.4% | 43.4% |
| Median | 30.6% | 37.2% |
| Interquartile 25% (IQ1) | 26.6% | 28.9% |
| Interquartile 75% (IQ3) | 34.8% | 54.6% |
| Interquartile Range (IQR) | 8.2% | 25.7% |
| Standard Deviation (Sample) | 13.9% | 22.5% |
| Standard Deviation (Population) | 13.8% | 22.3% |
Similar Demographics by Single Mother Poverty
Demographics Similar to Immigrants from El Salvador by Single Mother Poverty
In terms of single mother poverty, the demographic groups most similar to Immigrants from El Salvador are White/Caucasian (31.2%, a difference of 0.080%), Hmong (31.2%, a difference of 0.14%), Immigrants from Bangladesh (31.1%, a difference of 0.23%), Immigrants from Caribbean (31.1%, a difference of 0.27%), and Immigrants from Bahamas (31.1%, a difference of 0.35%).
| Demographics | Rating | Rank | Single Mother Poverty |
| Senegalese | 0.5 /100 | #254 | Tragic 31.0% |
| Belizeans | 0.5 /100 | #255 | Tragic 31.0% |
| Immigrants | West Indies | 0.4 /100 | #256 | Tragic 31.1% |
| Immigrants | Bahamas | 0.4 /100 | #257 | Tragic 31.1% |
| Immigrants | Caribbean | 0.4 /100 | #258 | Tragic 31.1% |
| Immigrants | Bangladesh | 0.4 /100 | #259 | Tragic 31.1% |
| Whites/Caucasians | 0.3 /100 | #260 | Tragic 31.2% |
| Immigrants | El Salvador | 0.3 /100 | #261 | Tragic 31.2% |
| Hmong | 0.3 /100 | #262 | Tragic 31.2% |
| Bahamians | 0.2 /100 | #263 | Tragic 31.3% |
| Immigrants | Ecuador | 0.2 /100 | #264 | Tragic 31.3% |
| German Russians | 0.2 /100 | #265 | Tragic 31.3% |
| Sub-Saharan Africans | 0.2 /100 | #266 | Tragic 31.4% |
| Immigrants | Belize | 0.2 /100 | #267 | Tragic 31.4% |
| Immigrants | Senegal | 0.1 /100 | #268 | Tragic 31.5% |
Demographics Similar to Pennsylvania Germans by Single Mother Poverty
In terms of single mother poverty, the demographic groups most similar to Pennsylvania Germans are African (33.3%, a difference of 0.11%), Blackfeet (33.2%, a difference of 0.14%), Immigrants from Guatemala (33.3%, a difference of 0.20%), Hispanic or Latino (33.3%, a difference of 0.20%), and Yaqui (33.1%, a difference of 0.30%).
| Demographics | Rating | Rank | Single Mother Poverty |
| Osage | 0.0 /100 | #290 | Tragic 32.6% |
| Guatemalans | 0.0 /100 | #291 | Tragic 32.9% |
| Shoshone | 0.0 /100 | #292 | Tragic 32.9% |
| Aleuts | 0.0 /100 | #293 | Tragic 32.9% |
| French American Indians | 0.0 /100 | #294 | Tragic 33.1% |
| Yaqui | 0.0 /100 | #295 | Tragic 33.1% |
| Blackfeet | 0.0 /100 | #296 | Tragic 33.2% |
| Pennsylvania Germans | 0.0 /100 | #297 | Tragic 33.2% |
| Africans | 0.0 /100 | #298 | Tragic 33.3% |
| Immigrants | Guatemala | 0.0 /100 | #299 | Tragic 33.3% |
| Hispanics or Latinos | 0.0 /100 | #300 | Tragic 33.3% |
| Immigrants | Somalia | 0.0 /100 | #301 | Tragic 33.4% |
| Arapaho | 0.0 /100 | #302 | Tragic 33.4% |
| Americans | 0.0 /100 | #303 | Tragic 33.5% |
| Mexicans | 0.0 /100 | #304 | Tragic 33.6% |