Immigrants from Egypt vs Yup'ik Family Poverty
COMPARE
Immigrants from Egypt
Yup'ik
Family Poverty
Family Poverty Comparison
Immigrants from Egypt
Yup'ik
8.3%
FAMILY POVERTY
91.6/ 100
METRIC RATING
120th/ 347
METRIC RANK
18.7%
FAMILY POVERTY
0.0/ 100
METRIC RATING
344th/ 347
METRIC RANK
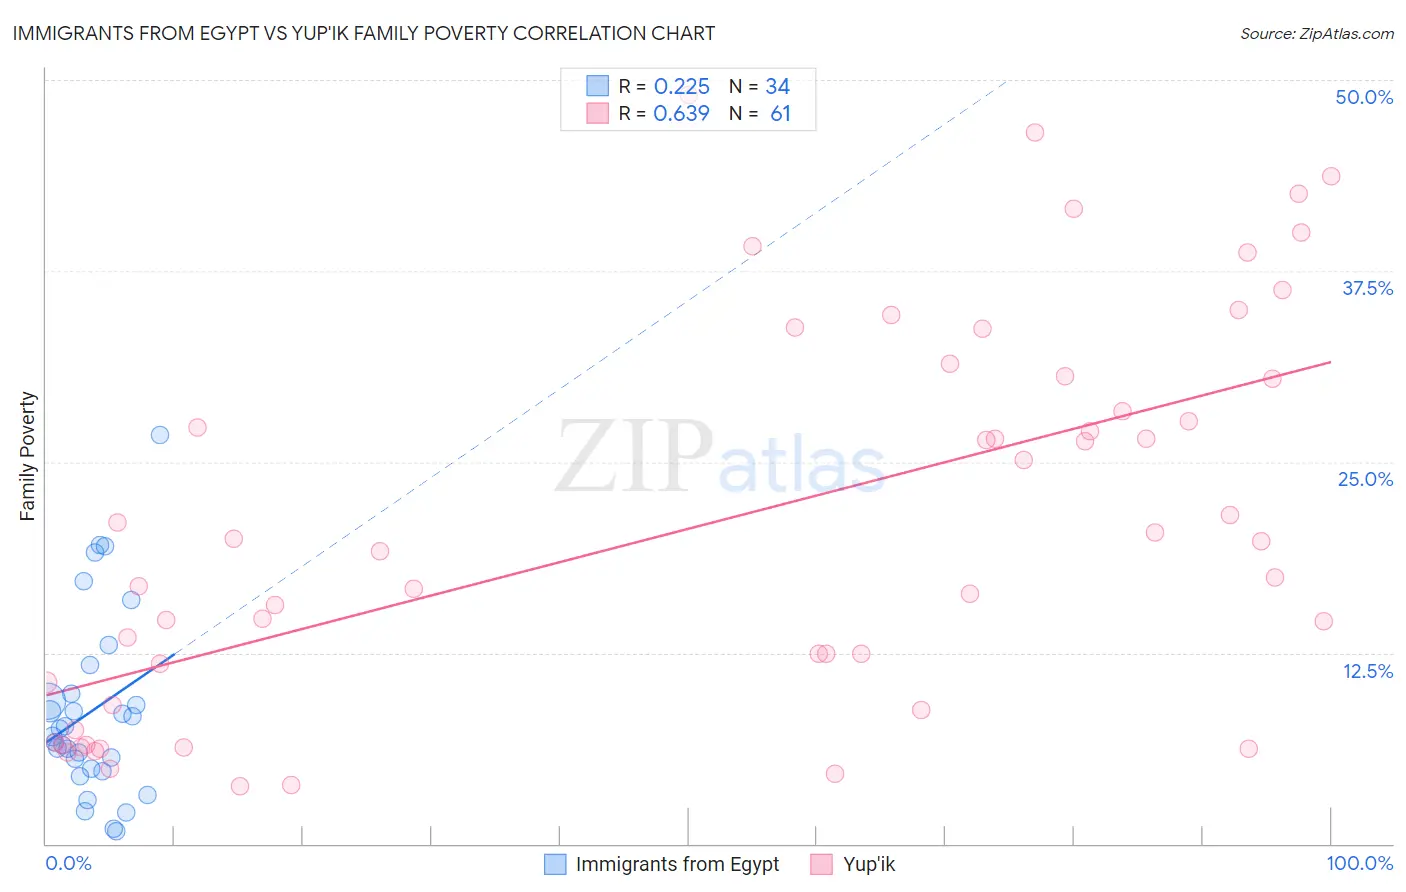
Immigrants from Egypt vs Yup'ik Family Poverty Correlation Chart
The statistical analysis conducted on geographies consisting of 245,176,811 people shows a weak positive correlation between the proportion of Immigrants from Egypt and poverty level among families in the United States with a correlation coefficient (R) of 0.225 and weighted average of 8.3%. Similarly, the statistical analysis conducted on geographies consisting of 39,939,403 people shows a significant positive correlation between the proportion of Yup'ik and poverty level among families in the United States with a correlation coefficient (R) of 0.639 and weighted average of 18.7%, a difference of 125.3%.
Family Poverty Correlation Summary
| Measurement | Immigrants from Egypt | Yup'ik |
| Minimum | 0.80% | 3.7% |
| Maximum | 26.7% | 49.0% |
| Range | 25.9% | 45.2% |
| Mean | 8.7% | 20.8% |
| Median | 7.3% | 19.1% |
| Interquartile 25% (IQ1) | 4.9% | 8.9% |
| Interquartile 75% (IQ3) | 9.8% | 30.5% |
| Interquartile Range (IQR) | 4.9% | 21.6% |
| Standard Deviation (Sample) | 6.0% | 12.7% |
| Standard Deviation (Population) | 5.9% | 12.6% |
Similar Demographics by Family Poverty
Demographics Similar to Immigrants from Egypt by Family Poverty
In terms of family poverty, the demographic groups most similar to Immigrants from Egypt are Native Hawaiian (8.3%, a difference of 0.17%), Paraguayan (8.3%, a difference of 0.18%), Palestinian (8.3%, a difference of 0.25%), Soviet Union (8.3%, a difference of 0.35%), and Pakistani (8.3%, a difference of 0.39%).
| Demographics | Rating | Rank | Family Poverty |
| Canadians | 94.2 /100 | #113 | Exceptional 8.2% |
| Immigrants | Zimbabwe | 94.0 /100 | #114 | Exceptional 8.2% |
| Immigrants | Israel | 93.5 /100 | #115 | Exceptional 8.2% |
| South Africans | 93.4 /100 | #116 | Exceptional 8.2% |
| Immigrants | Russia | 93.2 /100 | #117 | Exceptional 8.2% |
| Immigrants | Western Europe | 92.9 /100 | #118 | Exceptional 8.2% |
| French | 92.8 /100 | #119 | Exceptional 8.3% |
| Immigrants | Egypt | 91.6 /100 | #120 | Exceptional 8.3% |
| Native Hawaiians | 91.3 /100 | #121 | Exceptional 8.3% |
| Paraguayans | 91.2 /100 | #122 | Exceptional 8.3% |
| Palestinians | 91.1 /100 | #123 | Exceptional 8.3% |
| Soviet Union | 90.8 /100 | #124 | Exceptional 8.3% |
| Pakistanis | 90.8 /100 | #125 | Exceptional 8.3% |
| Icelanders | 90.3 /100 | #126 | Exceptional 8.3% |
| Immigrants | Hungary | 89.9 /100 | #127 | Excellent 8.4% |
Demographics Similar to Yup'ik by Family Poverty
In terms of family poverty, the demographic groups most similar to Yup'ik are Navajo (18.8%, a difference of 0.55%), Pima (18.4%, a difference of 1.8%), Immigrants from Yemen (17.5%, a difference of 7.1%), Puerto Rican (20.3%, a difference of 8.6%), and Tohono O'odham (20.4%, a difference of 9.0%).
| Demographics | Rating | Rank | Family Poverty |
| Immigrants | Dominican Republic | 0.0 /100 | #333 | Tragic 14.4% |
| Houma | 0.0 /100 | #334 | Tragic 14.6% |
| Apache | 0.0 /100 | #335 | Tragic 14.7% |
| Sioux | 0.0 /100 | #336 | Tragic 15.9% |
| Hopi | 0.0 /100 | #337 | Tragic 15.9% |
| Crow | 0.0 /100 | #338 | Tragic 16.1% |
| Yuman | 0.0 /100 | #339 | Tragic 16.6% |
| Pueblo | 0.0 /100 | #340 | Tragic 17.0% |
| Lumbee | 0.0 /100 | #341 | Tragic 17.0% |
| Immigrants | Yemen | 0.0 /100 | #342 | Tragic 17.5% |
| Pima | 0.0 /100 | #343 | Tragic 18.4% |
| Yup'ik | 0.0 /100 | #344 | Tragic 18.7% |
| Navajo | 0.0 /100 | #345 | Tragic 18.8% |
| Puerto Ricans | 0.0 /100 | #346 | Tragic 20.3% |
| Tohono O'odham | 0.0 /100 | #347 | Tragic 20.4% |