Immigrants from Egypt vs Immigrants from Mexico Child Poverty Among Boys Under 16
COMPARE
Immigrants from Egypt
Immigrants from Mexico
Child Poverty Among Boys Under 16
Child Poverty Among Boys Under 16 Comparison
Immigrants from Egypt
Immigrants from Mexico
14.9%
CHILD POVERTY AMONG BOYS UNDER 16
96.2/ 100
METRIC RATING
97th/ 347
METRIC RANK
21.5%
CHILD POVERTY AMONG BOYS UNDER 16
0.0/ 100
METRIC RATING
308th/ 347
METRIC RANK
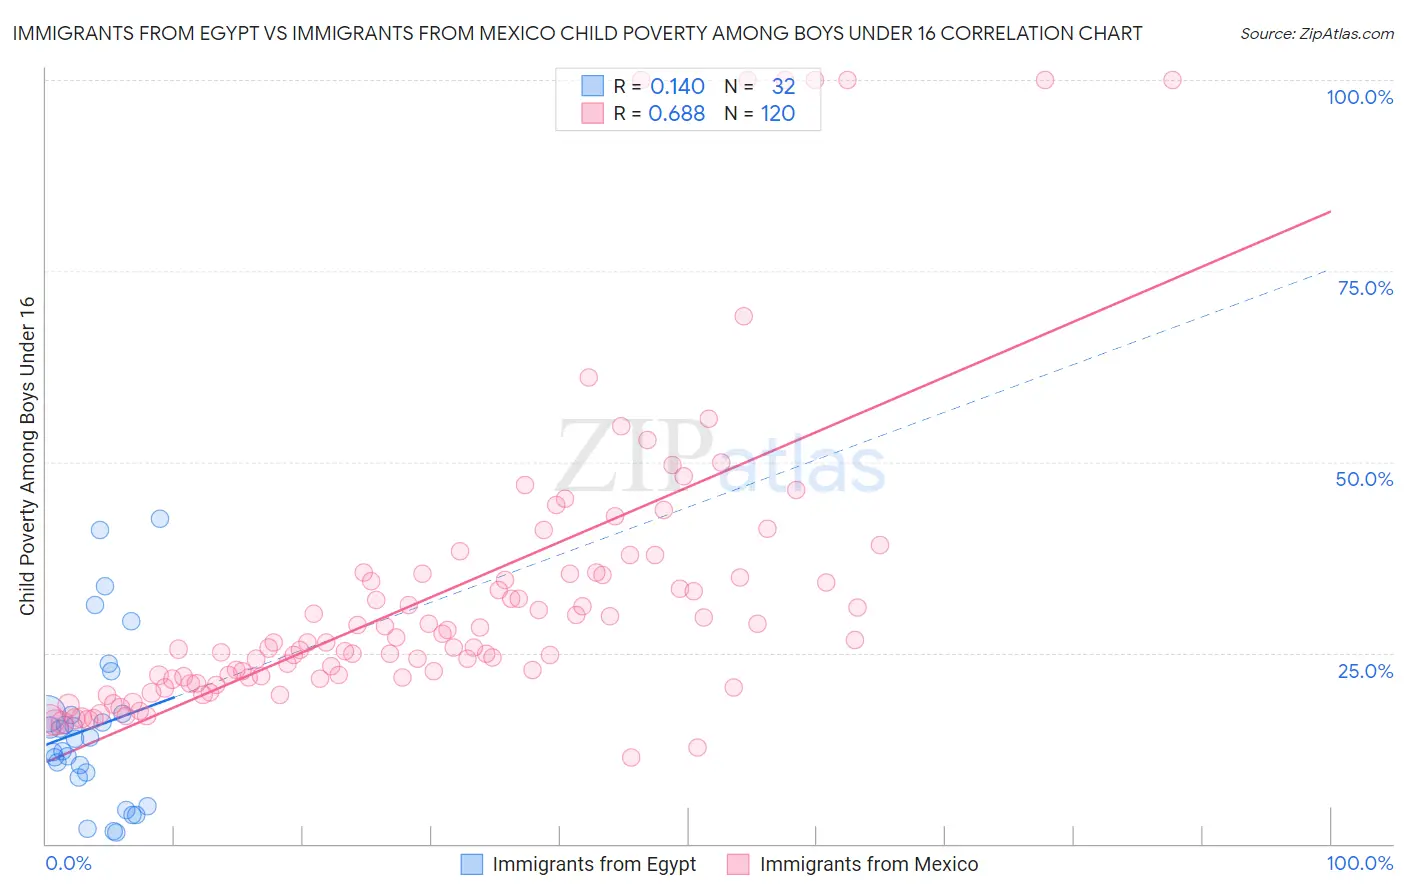
Immigrants from Egypt vs Immigrants from Mexico Child Poverty Among Boys Under 16 Correlation Chart
The statistical analysis conducted on geographies consisting of 242,739,180 people shows a poor positive correlation between the proportion of Immigrants from Egypt and poverty level among boys under the age of 16 in the United States with a correlation coefficient (R) of 0.140 and weighted average of 14.9%. Similarly, the statistical analysis conducted on geographies consisting of 502,962,166 people shows a significant positive correlation between the proportion of Immigrants from Mexico and poverty level among boys under the age of 16 in the United States with a correlation coefficient (R) of 0.688 and weighted average of 21.5%, a difference of 43.8%.
Child Poverty Among Boys Under 16 Correlation Summary
| Measurement | Immigrants from Egypt | Immigrants from Mexico |
| Minimum | 1.4% | 11.3% |
| Maximum | 42.5% | 100.0% |
| Range | 41.1% | 88.7% |
| Mean | 15.2% | 32.9% |
| Median | 13.8% | 26.3% |
| Interquartile 25% (IQ1) | 9.0% | 21.8% |
| Interquartile 75% (IQ3) | 17.0% | 35.4% |
| Interquartile Range (IQR) | 8.0% | 13.6% |
| Standard Deviation (Sample) | 10.7% | 19.8% |
| Standard Deviation (Population) | 10.5% | 19.7% |
Similar Demographics by Child Poverty Among Boys Under 16
Demographics Similar to Immigrants from Egypt by Child Poverty Among Boys Under 16
In terms of child poverty among boys under 16, the demographic groups most similar to Immigrants from Egypt are Immigrants from North Macedonia (14.9%, a difference of 0.010%), British (15.0%, a difference of 0.040%), Immigrants from France (15.0%, a difference of 0.14%), Finnish (14.9%, a difference of 0.26%), and Sri Lankan (14.9%, a difference of 0.37%).
| Demographics | Rating | Rank | Child Poverty Among Boys Under 16 |
| Austrians | 97.1 /100 | #90 | Exceptional 14.8% |
| Paraguayans | 96.8 /100 | #91 | Exceptional 14.9% |
| Argentineans | 96.7 /100 | #92 | Exceptional 14.9% |
| Sri Lankans | 96.7 /100 | #93 | Exceptional 14.9% |
| Immigrants | Italy | 96.7 /100 | #94 | Exceptional 14.9% |
| Finns | 96.5 /100 | #95 | Exceptional 14.9% |
| Immigrants | North Macedonia | 96.3 /100 | #96 | Exceptional 14.9% |
| Immigrants | Egypt | 96.2 /100 | #97 | Exceptional 14.9% |
| British | 96.2 /100 | #98 | Exceptional 15.0% |
| Immigrants | France | 96.1 /100 | #99 | Exceptional 15.0% |
| Chileans | 95.8 /100 | #100 | Exceptional 15.0% |
| Immigrants | Belarus | 95.7 /100 | #101 | Exceptional 15.0% |
| Romanians | 95.6 /100 | #102 | Exceptional 15.0% |
| Immigrants | Denmark | 95.6 /100 | #103 | Exceptional 15.0% |
| Immigrants | Switzerland | 95.4 /100 | #104 | Exceptional 15.0% |
Demographics Similar to Immigrants from Mexico by Child Poverty Among Boys Under 16
In terms of child poverty among boys under 16, the demographic groups most similar to Immigrants from Mexico are Seminole (21.5%, a difference of 0.18%), Creek (21.5%, a difference of 0.24%), Bahamian (21.6%, a difference of 0.35%), Immigrants from Guatemala (21.6%, a difference of 0.43%), and British West Indian (21.6%, a difference of 0.43%).
| Demographics | Rating | Rank | Child Poverty Among Boys Under 16 |
| Guatemalans | 0.0 /100 | #301 | Tragic 21.1% |
| Somalis | 0.0 /100 | #302 | Tragic 21.1% |
| Immigrants | Haiti | 0.0 /100 | #303 | Tragic 21.3% |
| Immigrants | Central America | 0.0 /100 | #304 | Tragic 21.3% |
| Kiowa | 0.0 /100 | #305 | Tragic 21.3% |
| Immigrants | Grenada | 0.0 /100 | #306 | Tragic 21.3% |
| Choctaw | 0.0 /100 | #307 | Tragic 21.3% |
| Immigrants | Mexico | 0.0 /100 | #308 | Tragic 21.5% |
| Seminole | 0.0 /100 | #309 | Tragic 21.5% |
| Creek | 0.0 /100 | #310 | Tragic 21.5% |
| Bahamians | 0.0 /100 | #311 | Tragic 21.6% |
| Immigrants | Guatemala | 0.0 /100 | #312 | Tragic 21.6% |
| British West Indians | 0.0 /100 | #313 | Tragic 21.6% |
| Ute | 0.0 /100 | #314 | Tragic 21.6% |
| Immigrants | Somalia | 0.0 /100 | #315 | Tragic 21.7% |