Immigrants from Egypt vs Immigrants from Eastern Africa Seniors Poverty Over the Age of 75
COMPARE
Immigrants from Egypt
Immigrants from Eastern Africa
Seniors Poverty Over the Age of 75
Seniors Poverty Over the Age of 75 Comparison
Immigrants from Egypt
Immigrants from Eastern Africa
12.2%
SENIORS POVERTY OVER THE AGE OF 75
53.7/ 100
METRIC RATING
169th/ 347
METRIC RANK
12.1%
SENIORS POVERTY OVER THE AGE OF 75
60.9/ 100
METRIC RATING
160th/ 347
METRIC RANK
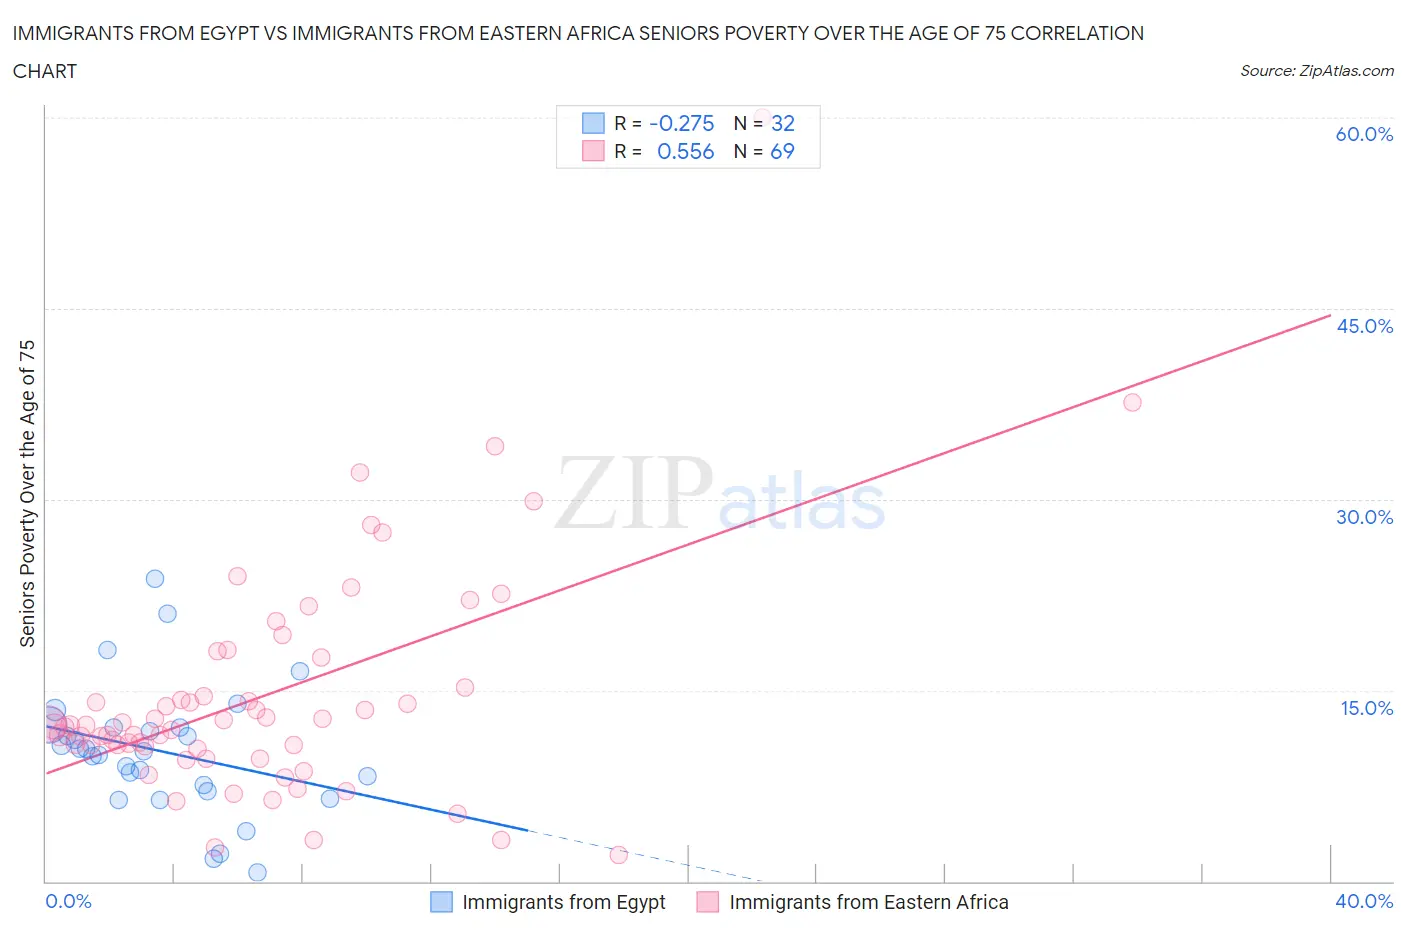
Immigrants from Egypt vs Immigrants from Eastern Africa Seniors Poverty Over the Age of 75 Correlation Chart
The statistical analysis conducted on geographies consisting of 243,675,721 people shows a weak negative correlation between the proportion of Immigrants from Egypt and poverty level among seniors over the age of 75 in the United States with a correlation coefficient (R) of -0.275 and weighted average of 12.2%. Similarly, the statistical analysis conducted on geographies consisting of 351,649,157 people shows a substantial positive correlation between the proportion of Immigrants from Eastern Africa and poverty level among seniors over the age of 75 in the United States with a correlation coefficient (R) of 0.556 and weighted average of 12.1%, a difference of 0.60%.
Seniors Poverty Over the Age of 75 Correlation Summary
| Measurement | Immigrants from Egypt | Immigrants from Eastern Africa |
| Minimum | 0.66% | 2.1% |
| Maximum | 23.7% | 60.0% |
| Range | 23.1% | 57.9% |
| Mean | 10.2% | 14.5% |
| Median | 10.3% | 12.3% |
| Interquartile 25% (IQ1) | 7.3% | 10.5% |
| Interquartile 75% (IQ3) | 12.1% | 16.4% |
| Interquartile Range (IQR) | 4.8% | 5.9% |
| Standard Deviation (Sample) | 5.0% | 9.1% |
| Standard Deviation (Population) | 5.0% | 9.1% |
Demographics Similar to Immigrants from Egypt and Immigrants from Eastern Africa by Seniors Poverty Over the Age of 75
In terms of seniors poverty over the age of 75, the demographic groups most similar to Immigrants from Egypt are Immigrants from Syria (12.2%, a difference of 0.010%), Immigrants from Switzerland (12.1%, a difference of 0.070%), Egyptian (12.1%, a difference of 0.090%), Immigrants from Thailand (12.2%, a difference of 0.14%), and Spaniard (12.2%, a difference of 0.18%). Similarly, the demographic groups most similar to Immigrants from Eastern Africa are Immigrants from Norway (12.1%, a difference of 0.020%), Portuguese (12.1%, a difference of 0.030%), Immigrants from Middle Africa (12.1%, a difference of 0.030%), Immigrants from Serbia (12.1%, a difference of 0.050%), and Immigrants from Sudan (12.1%, a difference of 0.070%).
| Demographics | Rating | Rank | Seniors Poverty Over the Age of 75 |
| Cambodians | 64.0 /100 | #154 | Good 12.0% |
| Indonesians | 62.6 /100 | #155 | Good 12.1% |
| Immigrants | Burma/Myanmar | 62.3 /100 | #156 | Good 12.1% |
| Immigrants | Sudan | 61.7 /100 | #157 | Good 12.1% |
| Portuguese | 61.3 /100 | #158 | Good 12.1% |
| Immigrants | Middle Africa | 61.2 /100 | #159 | Good 12.1% |
| Immigrants | Eastern Africa | 60.9 /100 | #160 | Good 12.1% |
| Immigrants | Norway | 60.6 /100 | #161 | Good 12.1% |
| Immigrants | Serbia | 60.2 /100 | #162 | Good 12.1% |
| Immigrants | Greece | 58.2 /100 | #163 | Average 12.1% |
| Potawatomi | 57.4 /100 | #164 | Average 12.1% |
| Okinawans | 56.3 /100 | #165 | Average 12.1% |
| Egyptians | 54.8 /100 | #166 | Average 12.1% |
| Immigrants | Switzerland | 54.5 /100 | #167 | Average 12.1% |
| Immigrants | Syria | 53.9 /100 | #168 | Average 12.2% |
| Immigrants | Egypt | 53.7 /100 | #169 | Average 12.2% |
| Immigrants | Thailand | 52.0 /100 | #170 | Average 12.2% |
| Spaniards | 51.6 /100 | #171 | Average 12.2% |
| Immigrants | Fiji | 51.5 /100 | #172 | Average 12.2% |
| Arabs | 50.5 /100 | #173 | Average 12.2% |
| Immigrants | Europe | 50.0 /100 | #174 | Average 12.2% |