Immigrants from Ecuador vs Yuman Female Poverty
COMPARE
Immigrants from Ecuador
Yuman
Female Poverty
Female Poverty Comparison
Immigrants from Ecuador
Yuman
15.6%
FEMALE POVERTY
0.1/ 100
METRIC RATING
264th/ 347
METRIC RANK
20.8%
FEMALE POVERTY
0.0/ 100
METRIC RATING
337th/ 347
METRIC RANK
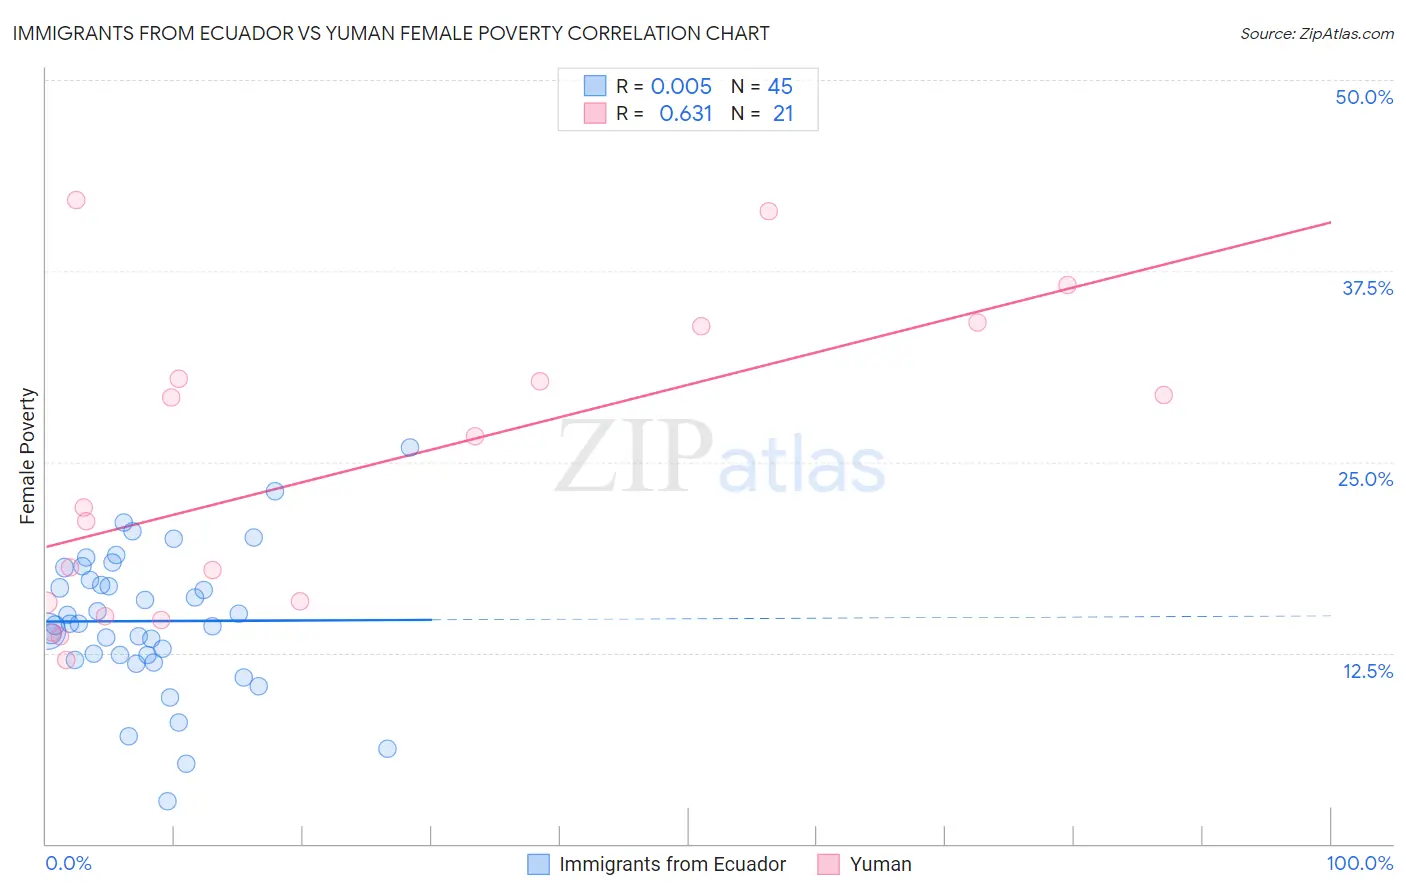
Immigrants from Ecuador vs Yuman Female Poverty Correlation Chart
The statistical analysis conducted on geographies consisting of 270,847,702 people shows no correlation between the proportion of Immigrants from Ecuador and poverty level among females in the United States with a correlation coefficient (R) of 0.005 and weighted average of 15.6%. Similarly, the statistical analysis conducted on geographies consisting of 40,663,290 people shows a significant positive correlation between the proportion of Yuman and poverty level among females in the United States with a correlation coefficient (R) of 0.631 and weighted average of 20.8%, a difference of 33.4%.
Female Poverty Correlation Summary
| Measurement | Immigrants from Ecuador | Yuman |
| Minimum | 2.8% | 12.1% |
| Maximum | 25.9% | 42.1% |
| Range | 23.1% | 30.1% |
| Mean | 14.6% | 24.5% |
| Median | 14.4% | 22.0% |
| Interquartile 25% (IQ1) | 12.2% | 15.3% |
| Interquartile 75% (IQ3) | 17.7% | 32.2% |
| Interquartile Range (IQR) | 5.5% | 16.8% |
| Standard Deviation (Sample) | 4.6% | 9.7% |
| Standard Deviation (Population) | 4.6% | 9.5% |
Similar Demographics by Female Poverty
Demographics Similar to Immigrants from Ecuador by Female Poverty
In terms of female poverty, the demographic groups most similar to Immigrants from Ecuador are Cherokee (15.6%, a difference of 0.13%), Guyanese (15.6%, a difference of 0.14%), Mexican American Indian (15.6%, a difference of 0.14%), Immigrants from Guyana (15.6%, a difference of 0.24%), and Immigrants from Liberia (15.7%, a difference of 0.30%).
| Demographics | Rating | Rank | Female Poverty |
| Immigrants | Jamaica | 0.1 /100 | #257 | Tragic 15.6% |
| Shoshone | 0.1 /100 | #258 | Tragic 15.6% |
| Cape Verdeans | 0.1 /100 | #259 | Tragic 15.6% |
| Immigrants | Guyana | 0.1 /100 | #260 | Tragic 15.6% |
| Guyanese | 0.1 /100 | #261 | Tragic 15.6% |
| Mexican American Indians | 0.1 /100 | #262 | Tragic 15.6% |
| Cherokee | 0.1 /100 | #263 | Tragic 15.6% |
| Immigrants | Ecuador | 0.1 /100 | #264 | Tragic 15.6% |
| Immigrants | Liberia | 0.1 /100 | #265 | Tragic 15.7% |
| Immigrants | El Salvador | 0.1 /100 | #266 | Tragic 15.7% |
| Sub-Saharan Africans | 0.1 /100 | #267 | Tragic 15.8% |
| Immigrants | Nicaragua | 0.1 /100 | #268 | Tragic 15.8% |
| Iroquois | 0.1 /100 | #269 | Tragic 15.8% |
| Chickasaw | 0.1 /100 | #270 | Tragic 15.9% |
| Immigrants | St. Vincent and the Grenadines | 0.0 /100 | #271 | Tragic 15.9% |
Demographics Similar to Yuman by Female Poverty
In terms of female poverty, the demographic groups most similar to Yuman are Sioux (20.9%, a difference of 0.19%), Hopi (21.0%, a difference of 0.56%), Pueblo (20.7%, a difference of 0.81%), Yup'ik (21.5%, a difference of 3.1%), and Cheyenne (20.2%, a difference of 3.2%).
| Demographics | Rating | Rank | Female Poverty |
| Dominicans | 0.0 /100 | #330 | Tragic 19.1% |
| Natives/Alaskans | 0.0 /100 | #331 | Tragic 19.2% |
| Apache | 0.0 /100 | #332 | Tragic 19.2% |
| Immigrants | Dominican Republic | 0.0 /100 | #333 | Tragic 19.3% |
| Houma | 0.0 /100 | #334 | Tragic 20.0% |
| Cheyenne | 0.0 /100 | #335 | Tragic 20.2% |
| Pueblo | 0.0 /100 | #336 | Tragic 20.7% |
| Yuman | 0.0 /100 | #337 | Tragic 20.8% |
| Sioux | 0.0 /100 | #338 | Tragic 20.9% |
| Hopi | 0.0 /100 | #339 | Tragic 21.0% |
| Yup'ik | 0.0 /100 | #340 | Tragic 21.5% |
| Crow | 0.0 /100 | #341 | Tragic 22.1% |
| Immigrants | Yemen | 0.0 /100 | #342 | Tragic 22.8% |
| Lumbee | 0.0 /100 | #343 | Tragic 23.5% |
| Pima | 0.0 /100 | #344 | Tragic 23.6% |