Immigrants from Ecuador vs Indian (Asian) Single Father Poverty
COMPARE
Immigrants from Ecuador
Indian (Asian)
Single Father Poverty
Single Father Poverty Comparison
Immigrants from Ecuador
Indians (Asian)
16.3%
SINGLE FATHER POVERTY
49.7/ 100
METRIC RATING
175th/ 347
METRIC RANK
14.8%
SINGLE FATHER POVERTY
100.0/ 100
METRIC RATING
41st/ 347
METRIC RANK
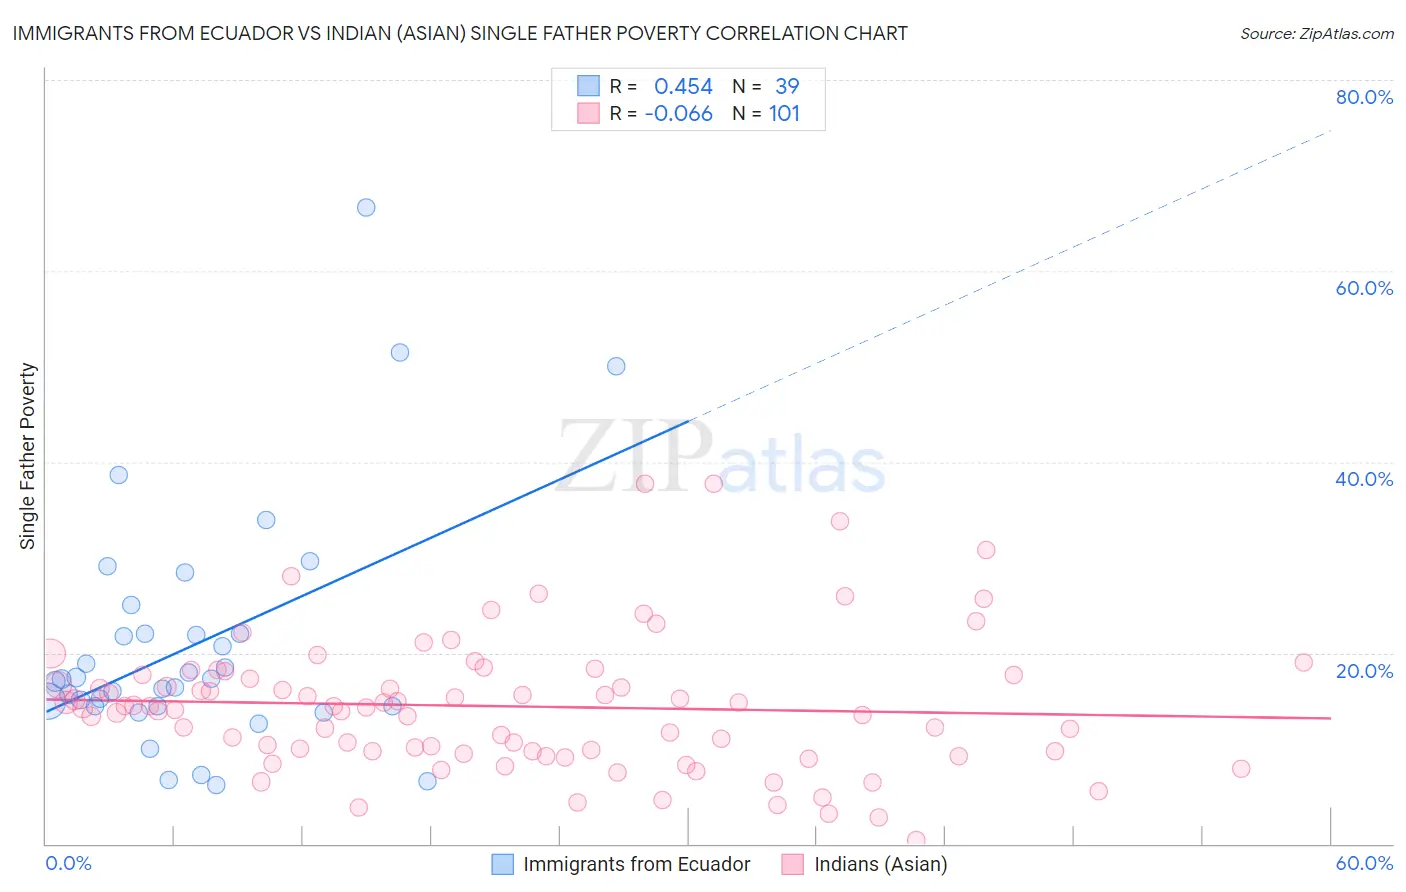
Immigrants from Ecuador vs Indian (Asian) Single Father Poverty Correlation Chart
The statistical analysis conducted on geographies consisting of 223,687,874 people shows a moderate positive correlation between the proportion of Immigrants from Ecuador and poverty level among single fathers in the United States with a correlation coefficient (R) of 0.454 and weighted average of 16.3%. Similarly, the statistical analysis conducted on geographies consisting of 373,368,189 people shows a slight negative correlation between the proportion of Indians (Asian) and poverty level among single fathers in the United States with a correlation coefficient (R) of -0.066 and weighted average of 14.8%, a difference of 10.2%.
Single Father Poverty Correlation Summary
| Measurement | Immigrants from Ecuador | Indian (Asian) |
| Minimum | 6.2% | 0.43% |
| Maximum | 66.7% | 37.7% |
| Range | 60.5% | 37.3% |
| Mean | 20.9% | 14.4% |
| Median | 17.3% | 14.2% |
| Interquartile 25% (IQ1) | 14.3% | 9.7% |
| Interquartile 75% (IQ3) | 22.0% | 17.7% |
| Interquartile Range (IQR) | 7.7% | 8.0% |
| Standard Deviation (Sample) | 12.7% | 7.1% |
| Standard Deviation (Population) | 12.5% | 7.0% |
Similar Demographics by Single Father Poverty
Demographics Similar to Immigrants from Ecuador by Single Father Poverty
In terms of single father poverty, the demographic groups most similar to Immigrants from Ecuador are Immigrants from Sierra Leone (16.3%, a difference of 0.020%), Immigrants from St. Vincent and the Grenadines (16.3%, a difference of 0.020%), Swedish (16.3%, a difference of 0.020%), Immigrants from Morocco (16.3%, a difference of 0.050%), and Vietnamese (16.3%, a difference of 0.070%).
| Demographics | Rating | Rank | Single Father Poverty |
| Costa Ricans | 53.6 /100 | #168 | Average 16.3% |
| Northern Europeans | 52.8 /100 | #169 | Average 16.3% |
| Scandinavians | 52.3 /100 | #170 | Average 16.3% |
| Immigrants | Morocco | 50.7 /100 | #171 | Average 16.3% |
| Immigrants | Sierra Leone | 50.1 /100 | #172 | Average 16.3% |
| Immigrants | St. Vincent and the Grenadines | 50.0 /100 | #173 | Average 16.3% |
| Swedes | 50.0 /100 | #174 | Average 16.3% |
| Immigrants | Ecuador | 49.7 /100 | #175 | Average 16.3% |
| Vietnamese | 48.0 /100 | #176 | Average 16.3% |
| Immigrants | South Africa | 44.2 /100 | #177 | Average 16.3% |
| Immigrants | Cuba | 41.6 /100 | #178 | Average 16.4% |
| Serbians | 40.9 /100 | #179 | Average 16.4% |
| Immigrants | Latin America | 37.2 /100 | #180 | Fair 16.4% |
| Immigrants | Western Africa | 36.0 /100 | #181 | Fair 16.4% |
| Immigrants | Italy | 35.7 /100 | #182 | Fair 16.4% |
Demographics Similar to Indians (Asian) by Single Father Poverty
In terms of single father poverty, the demographic groups most similar to Indians (Asian) are Immigrants from Nepal (14.8%, a difference of 0.0%), Immigrants from Eritrea (14.8%, a difference of 0.040%), Pima (14.8%, a difference of 0.17%), Immigrants from Asia (14.7%, a difference of 0.37%), and Bolivian (14.7%, a difference of 0.54%).
| Demographics | Rating | Rank | Single Father Poverty |
| Egyptians | 100.0 /100 | #34 | Exceptional 14.7% |
| Immigrants | Bolivia | 100.0 /100 | #35 | Exceptional 14.7% |
| Immigrants | Indonesia | 100.0 /100 | #36 | Exceptional 14.7% |
| Immigrants | Eastern Africa | 100.0 /100 | #37 | Exceptional 14.7% |
| Bolivians | 100.0 /100 | #38 | Exceptional 14.7% |
| Immigrants | Asia | 100.0 /100 | #39 | Exceptional 14.7% |
| Pima | 100.0 /100 | #40 | Exceptional 14.8% |
| Indians (Asian) | 100.0 /100 | #41 | Exceptional 14.8% |
| Immigrants | Nepal | 100.0 /100 | #42 | Exceptional 14.8% |
| Immigrants | Eritrea | 100.0 /100 | #43 | Exceptional 14.8% |
| Salvadorans | 100.0 /100 | #44 | Exceptional 14.9% |
| Immigrants | Somalia | 100.0 /100 | #45 | Exceptional 14.9% |
| Immigrants | Cambodia | 99.9 /100 | #46 | Exceptional 14.9% |
| Immigrants | China | 99.9 /100 | #47 | Exceptional 14.9% |
| Malaysians | 99.9 /100 | #48 | Exceptional 14.9% |