Immigrants from Ecuador vs Cheyenne Female Poverty Among 18-24 Year Olds
COMPARE
Immigrants from Ecuador
Cheyenne
Female Poverty Among 18-24 Year Olds
Female Poverty Among 18-24 Year Olds Comparison
Immigrants from Ecuador
Cheyenne
19.2%
FEMALE POVERTY AMONG 18-24 YEAR OLDS
97.8/ 100
METRIC RATING
105th/ 347
METRIC RANK
28.1%
FEMALE POVERTY AMONG 18-24 YEAR OLDS
0.0/ 100
METRIC RATING
337th/ 347
METRIC RANK
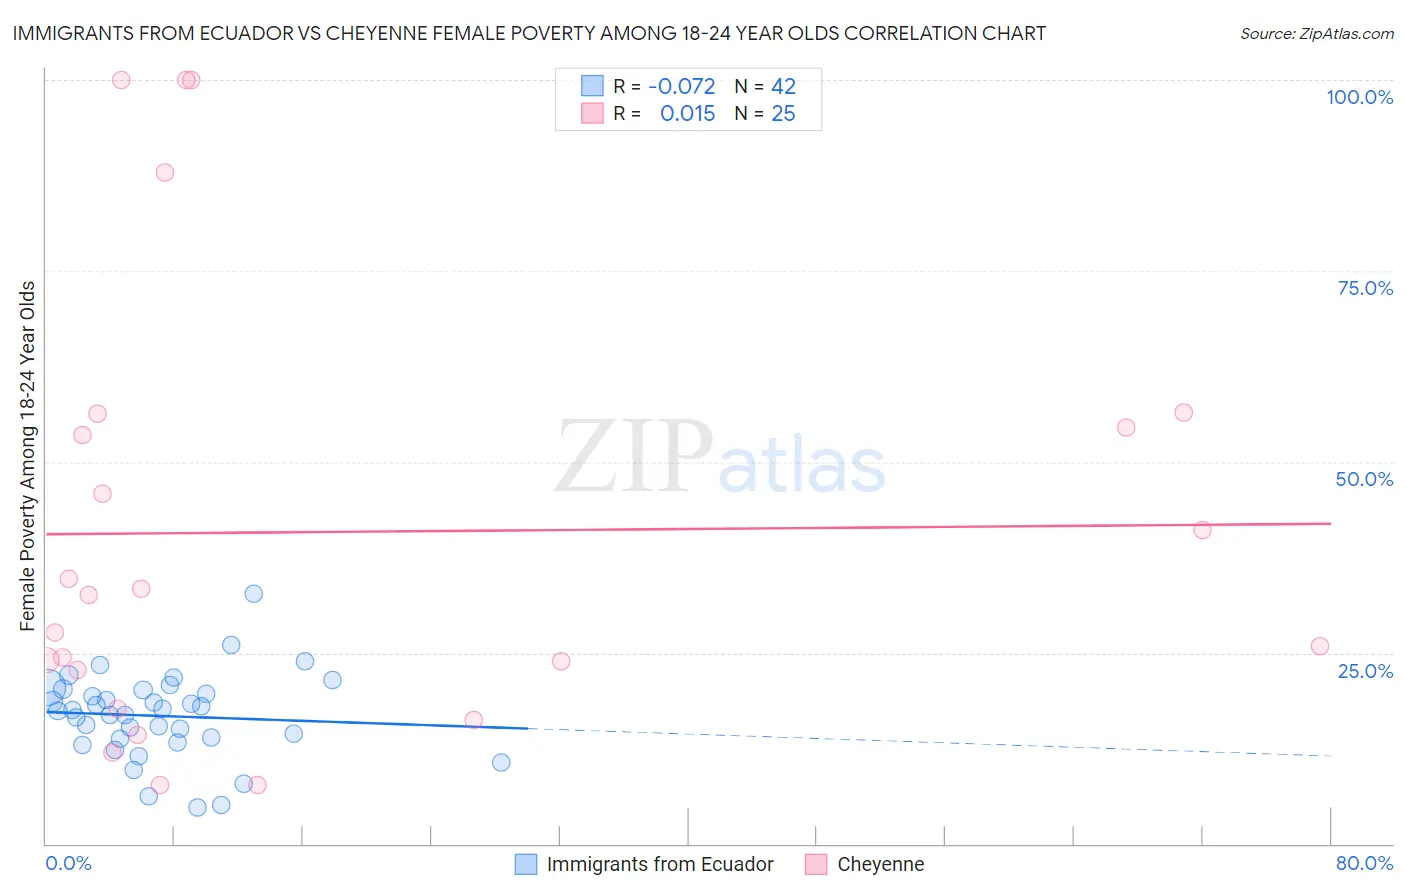
Immigrants from Ecuador vs Cheyenne Female Poverty Among 18-24 Year Olds Correlation Chart
The statistical analysis conducted on geographies consisting of 266,188,241 people shows a slight negative correlation between the proportion of Immigrants from Ecuador and poverty level among females between the ages 18 and 24 in the United States with a correlation coefficient (R) of -0.072 and weighted average of 19.2%. Similarly, the statistical analysis conducted on geographies consisting of 80,212,982 people shows no correlation between the proportion of Cheyenne and poverty level among females between the ages 18 and 24 in the United States with a correlation coefficient (R) of 0.015 and weighted average of 28.1%, a difference of 46.9%.
Female Poverty Among 18-24 Year Olds Correlation Summary
| Measurement | Immigrants from Ecuador | Cheyenne |
| Minimum | 4.7% | 7.7% |
| Maximum | 32.8% | 100.0% |
| Range | 28.1% | 92.3% |
| Mean | 16.7% | 40.8% |
| Median | 17.5% | 32.6% |
| Interquartile 25% (IQ1) | 13.7% | 20.2% |
| Interquartile 75% (IQ3) | 20.2% | 55.5% |
| Interquartile Range (IQR) | 6.5% | 35.2% |
| Standard Deviation (Sample) | 5.5% | 29.0% |
| Standard Deviation (Population) | 5.5% | 28.4% |
Similar Demographics by Female Poverty Among 18-24 Year Olds
Demographics Similar to Immigrants from Ecuador by Female Poverty Among 18-24 Year Olds
In terms of female poverty among 18-24 year olds, the demographic groups most similar to Immigrants from Ecuador are Immigrants from Sierra Leone (19.2%, a difference of 0.040%), Immigrants from Afghanistan (19.1%, a difference of 0.090%), Serbian (19.1%, a difference of 0.13%), Immigrants from Caribbean (19.1%, a difference of 0.17%), and Ecuadorian (19.1%, a difference of 0.19%).
| Demographics | Rating | Rank | Female Poverty Among 18-24 Year Olds |
| Immigrants | Jordan | 98.4 /100 | #98 | Exceptional 19.1% |
| Immigrants | Czechoslovakia | 98.3 /100 | #99 | Exceptional 19.1% |
| Chileans | 98.3 /100 | #100 | Exceptional 19.1% |
| Ecuadorians | 98.1 /100 | #101 | Exceptional 19.1% |
| Immigrants | Caribbean | 98.1 /100 | #102 | Exceptional 19.1% |
| Serbians | 98.0 /100 | #103 | Exceptional 19.1% |
| Immigrants | Afghanistan | 98.0 /100 | #104 | Exceptional 19.1% |
| Immigrants | Ecuador | 97.8 /100 | #105 | Exceptional 19.2% |
| Immigrants | Sierra Leone | 97.8 /100 | #106 | Exceptional 19.2% |
| Immigrants | Sri Lanka | 97.5 /100 | #107 | Exceptional 19.2% |
| Immigrants | Uzbekistan | 97.3 /100 | #108 | Exceptional 19.2% |
| Immigrants | Syria | 97.2 /100 | #109 | Exceptional 19.2% |
| Laotians | 97.1 /100 | #110 | Exceptional 19.2% |
| Immigrants | Serbia | 97.1 /100 | #111 | Exceptional 19.2% |
| Immigrants | El Salvador | 96.5 /100 | #112 | Exceptional 19.3% |
Demographics Similar to Cheyenne by Female Poverty Among 18-24 Year Olds
In terms of female poverty among 18-24 year olds, the demographic groups most similar to Cheyenne are Hopi (28.2%, a difference of 0.21%), Pima (28.4%, a difference of 0.94%), Sioux (28.6%, a difference of 1.5%), Immigrants from Yemen (27.5%, a difference of 2.2%), and Colville (29.0%, a difference of 3.1%).
| Demographics | Rating | Rank | Female Poverty Among 18-24 Year Olds |
| Immigrants | Somalia | 0.0 /100 | #330 | Tragic 25.7% |
| Chippewa | 0.0 /100 | #331 | Tragic 25.9% |
| Houma | 0.0 /100 | #332 | Tragic 26.2% |
| Apache | 0.0 /100 | #333 | Tragic 26.3% |
| Pueblo | 0.0 /100 | #334 | Tragic 26.9% |
| Yup'ik | 0.0 /100 | #335 | Tragic 27.0% |
| Immigrants | Yemen | 0.0 /100 | #336 | Tragic 27.5% |
| Cheyenne | 0.0 /100 | #337 | Tragic 28.1% |
| Hopi | 0.0 /100 | #338 | Tragic 28.2% |
| Pima | 0.0 /100 | #339 | Tragic 28.4% |
| Sioux | 0.0 /100 | #340 | Tragic 28.6% |
| Colville | 0.0 /100 | #341 | Tragic 29.0% |
| Kiowa | 0.0 /100 | #342 | Tragic 29.2% |
| Puerto Ricans | 0.0 /100 | #343 | Tragic 29.8% |
| Navajo | 0.0 /100 | #344 | Tragic 30.3% |