Immigrants from Eastern Europe vs Moroccan Child Poverty Among Girls Under 16
COMPARE
Immigrants from Eastern Europe
Moroccan
Child Poverty Among Girls Under 16
Child Poverty Among Girls Under 16 Comparison
Immigrants from Eastern Europe
Moroccans
14.6%
CHILD POVERTY AMONG GIRLS UNDER 16
98.0/ 100
METRIC RATING
75th/ 347
METRIC RANK
17.8%
CHILD POVERTY AMONG GIRLS UNDER 16
5.5/ 100
METRIC RATING
216th/ 347
METRIC RANK
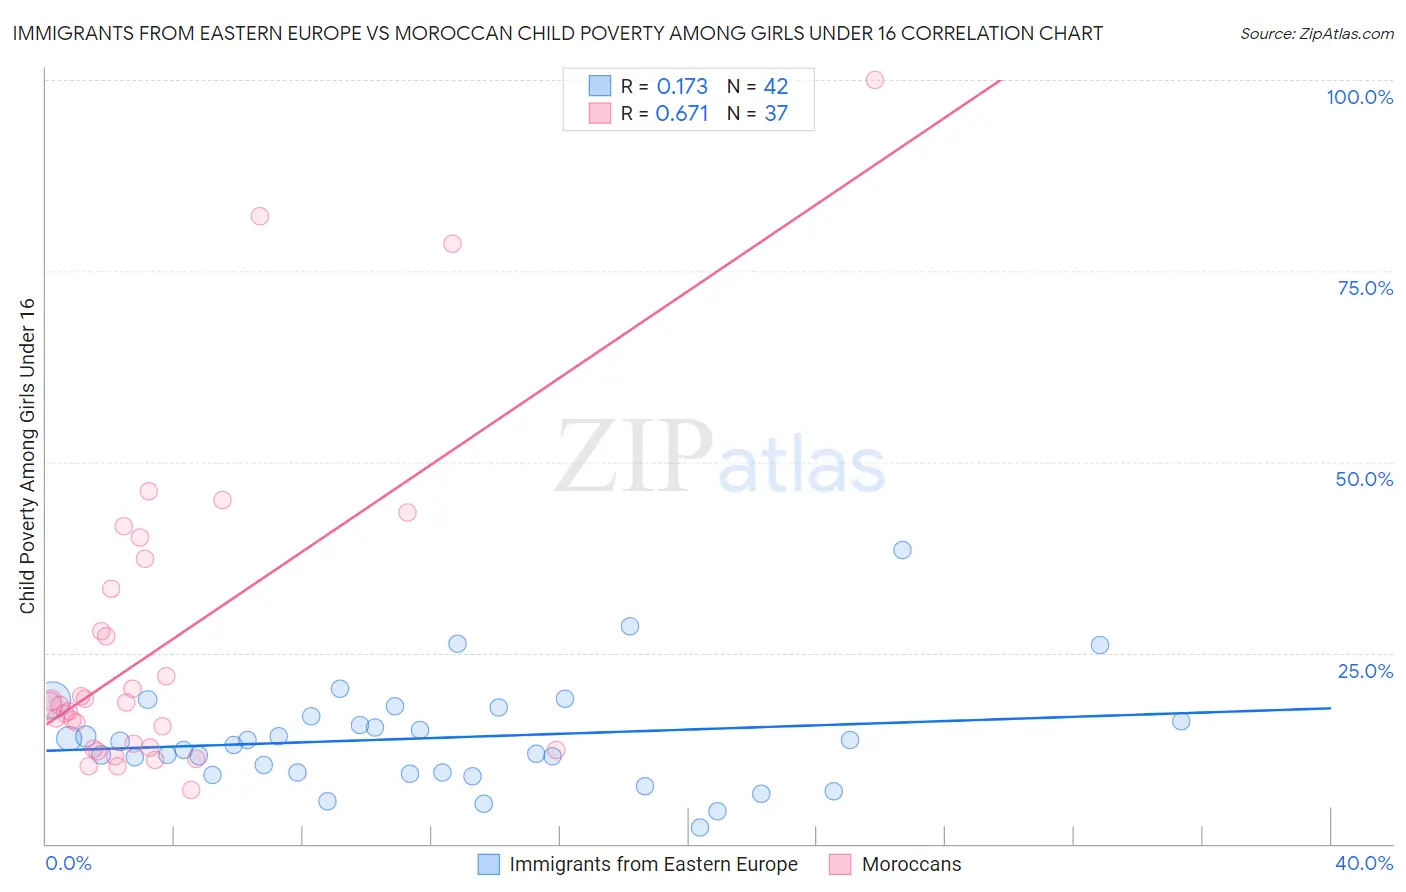
Immigrants from Eastern Europe vs Moroccan Child Poverty Among Girls Under 16 Correlation Chart
The statistical analysis conducted on geographies consisting of 462,372,791 people shows a poor positive correlation between the proportion of Immigrants from Eastern Europe and poverty level among girls under the age of 16 in the United States with a correlation coefficient (R) of 0.173 and weighted average of 14.6%. Similarly, the statistical analysis conducted on geographies consisting of 200,064,228 people shows a significant positive correlation between the proportion of Moroccans and poverty level among girls under the age of 16 in the United States with a correlation coefficient (R) of 0.671 and weighted average of 17.8%, a difference of 21.7%.
Child Poverty Among Girls Under 16 Correlation Summary
| Measurement | Immigrants from Eastern Europe | Moroccan |
| Minimum | 2.1% | 7.0% |
| Maximum | 38.5% | 100.0% |
| Range | 36.4% | 93.0% |
| Mean | 13.8% | 26.4% |
| Median | 13.1% | 18.1% |
| Interquartile 25% (IQ1) | 9.3% | 12.6% |
| Interquartile 75% (IQ3) | 16.7% | 35.4% |
| Interquartile Range (IQR) | 7.4% | 22.8% |
| Standard Deviation (Sample) | 6.9% | 21.4% |
| Standard Deviation (Population) | 6.8% | 21.1% |
Similar Demographics by Child Poverty Among Girls Under 16
Demographics Similar to Immigrants from Eastern Europe by Child Poverty Among Girls Under 16
In terms of child poverty among girls under 16, the demographic groups most similar to Immigrants from Eastern Europe are Taiwanese (14.6%, a difference of 0.070%), Immigrants from Austria (14.6%, a difference of 0.10%), Immigrants from Russia (14.7%, a difference of 0.15%), Tlingit-Haida (14.7%, a difference of 0.16%), and Argentinean (14.7%, a difference of 0.16%).
| Demographics | Rating | Rank | Child Poverty Among Girls Under 16 |
| Immigrants | Argentina | 98.3 /100 | #68 | Exceptional 14.6% |
| Immigrants | Poland | 98.2 /100 | #69 | Exceptional 14.6% |
| Europeans | 98.1 /100 | #70 | Exceptional 14.6% |
| Slovenes | 98.1 /100 | #71 | Exceptional 14.6% |
| Immigrants | Netherlands | 98.1 /100 | #72 | Exceptional 14.6% |
| Immigrants | Austria | 98.0 /100 | #73 | Exceptional 14.6% |
| Taiwanese | 98.0 /100 | #74 | Exceptional 14.6% |
| Immigrants | Eastern Europe | 98.0 /100 | #75 | Exceptional 14.6% |
| Immigrants | Russia | 97.9 /100 | #76 | Exceptional 14.7% |
| Tlingit-Haida | 97.9 /100 | #77 | Exceptional 14.7% |
| Argentineans | 97.9 /100 | #78 | Exceptional 14.7% |
| Immigrants | Turkey | 97.9 /100 | #79 | Exceptional 14.7% |
| Egyptians | 97.9 /100 | #80 | Exceptional 14.7% |
| Ukrainians | 97.7 /100 | #81 | Exceptional 14.7% |
| Macedonians | 97.6 /100 | #82 | Exceptional 14.7% |
Demographics Similar to Moroccans by Child Poverty Among Girls Under 16
In terms of child poverty among girls under 16, the demographic groups most similar to Moroccans are Japanese (17.8%, a difference of 0.090%), Malaysian (17.8%, a difference of 0.10%), German Russian (17.8%, a difference of 0.10%), Pennsylvania German (17.8%, a difference of 0.12%), and Alaska Native (17.8%, a difference of 0.18%).
| Demographics | Rating | Rank | Child Poverty Among Girls Under 16 |
| Panamanians | 8.7 /100 | #209 | Tragic 17.6% |
| Immigrants | Immigrants | 7.3 /100 | #210 | Tragic 17.7% |
| Immigrants | Eastern Africa | 6.4 /100 | #211 | Tragic 17.7% |
| Immigrants | Thailand | 6.3 /100 | #212 | Tragic 17.7% |
| Pennsylvania Germans | 5.7 /100 | #213 | Tragic 17.8% |
| Malaysians | 5.7 /100 | #214 | Tragic 17.8% |
| German Russians | 5.7 /100 | #215 | Tragic 17.8% |
| Moroccans | 5.5 /100 | #216 | Tragic 17.8% |
| Japanese | 5.3 /100 | #217 | Tragic 17.8% |
| Alaska Natives | 5.2 /100 | #218 | Tragic 17.8% |
| Immigrants | Panama | 4.7 /100 | #219 | Tragic 17.9% |
| Cubans | 4.1 /100 | #220 | Tragic 18.0% |
| Immigrants | Micronesia | 3.5 /100 | #221 | Tragic 18.0% |
| Immigrants | Cambodia | 2.9 /100 | #222 | Tragic 18.1% |
| Immigrants | Armenia | 2.9 /100 | #223 | Tragic 18.1% |