Immigrants from Eastern Europe vs Immigrants from Austria Male Poverty
COMPARE
Immigrants from Eastern Europe
Immigrants from Austria
Male Poverty
Male Poverty Comparison
Immigrants from Eastern Europe
Immigrants from Austria
10.2%
MALE POVERTY
96.9/ 100
METRIC RATING
74th/ 347
METRIC RANK
10.0%
MALE POVERTY
98.5/ 100
METRIC RATING
54th/ 347
METRIC RANK
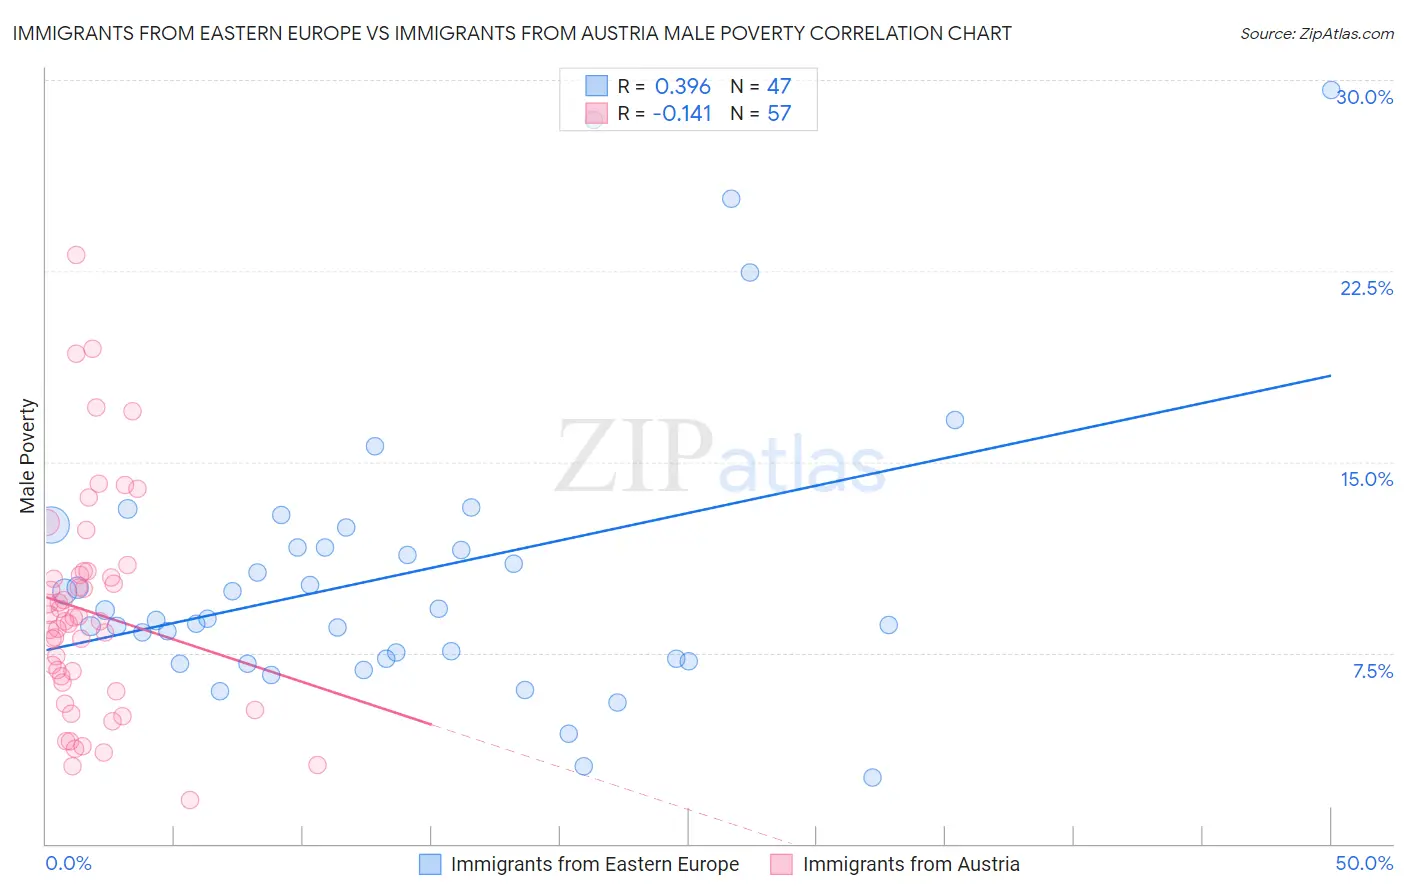
Immigrants from Eastern Europe vs Immigrants from Austria Male Poverty Correlation Chart
The statistical analysis conducted on geographies consisting of 475,131,955 people shows a mild positive correlation between the proportion of Immigrants from Eastern Europe and poverty level among males in the United States with a correlation coefficient (R) of 0.396 and weighted average of 10.2%. Similarly, the statistical analysis conducted on geographies consisting of 167,922,169 people shows a poor negative correlation between the proportion of Immigrants from Austria and poverty level among males in the United States with a correlation coefficient (R) of -0.141 and weighted average of 10.0%, a difference of 2.0%.
Male Poverty Correlation Summary
| Measurement | Immigrants from Eastern Europe | Immigrants from Austria |
| Minimum | 2.6% | 1.7% |
| Maximum | 29.6% | 23.1% |
| Range | 27.0% | 21.4% |
| Mean | 10.6% | 9.1% |
| Median | 8.8% | 8.7% |
| Interquartile 25% (IQ1) | 7.3% | 6.2% |
| Interquartile 75% (IQ3) | 11.7% | 10.6% |
| Interquartile Range (IQR) | 4.4% | 4.5% |
| Standard Deviation (Sample) | 5.7% | 4.4% |
| Standard Deviation (Population) | 5.7% | 4.3% |
Demographics Similar to Immigrants from Eastern Europe and Immigrants from Austria by Male Poverty
In terms of male poverty, the demographic groups most similar to Immigrants from Eastern Europe are Immigrants from Asia (10.2%, a difference of 0.070%), European (10.2%, a difference of 0.16%), Immigrants from Canada (10.2%, a difference of 0.16%), Paraguayan (10.2%, a difference of 0.19%), and Immigrants from Australia (10.2%, a difference of 0.21%). Similarly, the demographic groups most similar to Immigrants from Austria are German (10.1%, a difference of 0.29%), Immigrants from Bulgaria (10.1%, a difference of 0.50%), Estonian (10.1%, a difference of 0.64%), Scandinavian (10.1%, a difference of 0.71%), and Immigrants from Europe (10.1%, a difference of 0.85%).
| Demographics | Rating | Rank | Male Poverty |
| Immigrants | Austria | 98.5 /100 | #54 | Exceptional 10.0% |
| Germans | 98.3 /100 | #55 | Exceptional 10.1% |
| Immigrants | Bulgaria | 98.2 /100 | #56 | Exceptional 10.1% |
| Estonians | 98.1 /100 | #57 | Exceptional 10.1% |
| Scandinavians | 98.0 /100 | #58 | Exceptional 10.1% |
| Immigrants | Europe | 97.9 /100 | #59 | Exceptional 10.1% |
| Ukrainians | 97.9 /100 | #60 | Exceptional 10.1% |
| Austrians | 97.8 /100 | #61 | Exceptional 10.1% |
| Immigrants | Italy | 97.8 /100 | #62 | Exceptional 10.2% |
| Slovaks | 97.7 /100 | #63 | Exceptional 10.2% |
| Swiss | 97.5 /100 | #64 | Exceptional 10.2% |
| Zimbabweans | 97.5 /100 | #65 | Exceptional 10.2% |
| Serbians | 97.5 /100 | #66 | Exceptional 10.2% |
| Immigrants | Netherlands | 97.3 /100 | #67 | Exceptional 10.2% |
| Immigrants | Sri Lanka | 97.2 /100 | #68 | Exceptional 10.2% |
| Immigrants | Australia | 97.1 /100 | #69 | Exceptional 10.2% |
| Paraguayans | 97.1 /100 | #70 | Exceptional 10.2% |
| Europeans | 97.1 /100 | #71 | Exceptional 10.2% |
| Immigrants | Canada | 97.1 /100 | #72 | Exceptional 10.2% |
| Immigrants | Asia | 97.0 /100 | #73 | Exceptional 10.2% |
| Immigrants | Eastern Europe | 96.9 /100 | #74 | Exceptional 10.2% |