Immigrants from Eastern Europe vs Bhutanese Female Poverty Among 25-34 Year Olds

COMPARE

Immigrants from Eastern Europe
Race
Ancestry
AfghanAfricanAlaska NativeAlaskan AthabascanAlbanianAleutAlsatianAmericanApacheArabArapahoArgentineanArmenianAssyrian/Chaldean/SyriacAustralianAustrianBahamianBangladeshiBarbadianBasqueBelgianBelizeanBermudanBlackfeetBolivianBrazilianBritishBritish West IndianBulgarianBurmeseCajunCambodianCanadianCape VerdeanCarpatho RusynCelticCentral AmericanCentral American IndianCherokeeCheyenneChickasawChileanChineseChippewaChoctawColombianColvilleComancheCosta RicanCreeCreekCroatianCrowCubanCypriotCzechCzechoslovakianDanishDelawareDominicanDutchDutch West IndianEastern EuropeanEcuadorianEgyptianEnglishEstonianEthiopianEuropeanFijianFilipinoFinnishFrenchFrench American IndianFrench CanadianGermanGerman RussianGhanaianGreekGuamanian/ChamorroGuatemalanGuyaneseHaitianHmongHonduranHopiHoumaHungarianIcelanderIndian (Asian)IndonesianInupiatIranianIraqiIrishIroquoisIsraeliItalianJamaicanJapaneseJordanianKenyanKiowaKoreanLaotianLatvianLebaneseLiberianLithuanianLumbeeLuxembourgerMacedonianMalaysianMalteseMarshalleseMenomineeMexicanMexican American IndianMongolianMoroccanNative HawaiianNavajoNepaleseNew ZealanderNicaraguanNigerianNorthern EuropeanNorwegianOkinawanOsageOttawaPaiutePakistaniPalestinianPanamanianParaguayanPennsylvania GermanPeruvianPimaPolishPortuguesePotawatomiPuebloPuerto RicanPuget Sound SalishRomanianRussianSalvadoranSamoanScandinavianScotch-IrishScottishSeminoleSenegaleseSerbianShoshoneSierra LeoneanSiouxSlavicSlovakSloveneSomaliSouth AfricanSouth AmericanSouth American IndianSoviet UnionSpaniardSpanishSpanish AmericanSpanish American IndianSri LankanSubsaharan AfricanSudaneseSwedishSwissSyrianTaiwaneseThaiTlingit-HaidaTohono O'OdhamTonganTrinidadian and TobagonianTsimshianTurkishU.S. Virgin IslanderUgandanUkrainianUruguayanUteVenezuelanVietnameseWelshWest IndianYakamaYaquiYugoslavianYumanYup'ikZimbabwean
Immigration
NonimmigrantsImmigrantsAfghanistanAfricaAlbaniaArgentinaArmeniaAsiaAustraliaAustriaBahamasBangladeshBarbadosBelarusBelgiumBelizeBoliviaBosnia and HerzegovinaBrazilBulgariaBurma/MyanmarCabo VerdeCambodiaCameroonCanadaCaribbeanCentral AmericaChileChinaColombiaCongoCosta RicaCroatiaCubaCzechoslovakiaDenmarkDominicaDominican RepublicEastern AfricaEastern AsiaEastern EuropeEcuadorEgyptEl SalvadorEnglandEritreaEthiopiaEuropeFijiFranceGermanyGhanaGreeceGrenadaGuatemalaGuyanaHaitiHondurasHong KongHungaryIndiaIndonesiaIranIraqIrelandIsraelItalyJamaicaJapanJordanKazakhstanKenyaKoreaKuwaitLaosLatin AmericaLatviaLebanonLiberiaLithuaniaMalaysiaMexicoMicronesiaMiddle AfricaMoldovaMoroccoNepalNetherlandsNicaraguaNigeriaNorth AmericaNorth MacedoniaNorthern AfricaNorthern EuropeNorwayOceaniaPakistanPanamaPeruPhilippinesPolandPortugalRomaniaRussiaSaudi ArabiaScotlandSenegalSerbiaSierra LeoneSingaporeSomaliaSouth AfricaSouth AmericaSouth Central AsiaSouth Eastern AsiaSouthern EuropeSpainSri LankaSt. Vincent and the GrenadinesSudanSwedenSwitzerlandSyriaTaiwanThailandTrinidad and TobagoTurkeyUgandaUkraineUruguayUzbekistanVenezuelaVietnamWest IndiesWestern AfricaWestern AsiaWestern EuropeYemenZaireZimbabweAzores
Bhutanese
Race
Ancestry
AfghanAfricanAlaska NativeAlaskan AthabascanAlbanianAleutAlsatianAmericanApacheArabArapahoArgentineanArmenianAssyrian/Chaldean/SyriacAustralianAustrianBahamianBangladeshiBarbadianBasqueBelgianBelizeanBermudanBhutaneseBlackfeetBolivianBrazilianBritishBritish West IndianBulgarianBurmeseCajunCambodianCanadianCape VerdeanCarpatho RusynCelticCentral AmericanCentral American IndianCherokeeCheyenneChickasawChileanChineseChippewaChoctawColombianColvilleComancheCosta RicanCreeCreekCroatianCrowCubanCypriotCzechCzechoslovakianDanishDelawareDominicanDutchDutch West IndianEastern EuropeanEcuadorianEgyptianEnglishEstonianEthiopianEuropeanFijianFilipinoFinnishFrenchFrench American IndianFrench CanadianGermanGerman RussianGhanaianGreekGuamanian/ChamorroGuatemalanGuyaneseHaitianHmongHonduranHopiHoumaHungarianIcelanderIndian (Asian)IndonesianInupiatIranianIraqiIrishIroquoisIsraeliItalianJamaicanJapaneseJordanianKenyanKiowaKoreanLaotianLatvianLebaneseLiberianLithuanianLumbeeLuxembourgerMacedonianMalaysianMalteseMarshalleseMenomineeMexicanMexican American IndianMongolianMoroccanNative HawaiianNavajoNepaleseNew ZealanderNicaraguanNigerianNorthern EuropeanNorwegianOkinawanOsageOttawaPaiutePakistaniPalestinianPanamanianParaguayanPennsylvania GermanPeruvianPimaPolishPortuguesePotawatomiPuebloPuerto RicanPuget Sound SalishRomanianRussianSalvadoranSamoanScandinavianScotch-IrishScottishSeminoleSenegaleseSerbianShoshoneSierra LeoneanSiouxSlavicSlovakSloveneSomaliSouth AfricanSouth AmericanSouth American IndianSoviet UnionSpaniardSpanishSpanish AmericanSpanish American IndianSri LankanSubsaharan AfricanSudaneseSwedishSwissSyrianTaiwaneseThaiTlingit-HaidaTohono O'OdhamTonganTrinidadian and TobagonianTsimshianTurkishU.S. Virgin IslanderUgandanUkrainianUruguayanUteVenezuelanVietnameseWelshWest IndianYakamaYaquiYugoslavianYumanYup'ikZimbabwean
Immigration
NonimmigrantsImmigrantsAfghanistanAfricaAlbaniaArgentinaArmeniaAsiaAustraliaAustriaBahamasBangladeshBarbadosBelarusBelgiumBelizeBoliviaBosnia and HerzegovinaBrazilBulgariaBurma/MyanmarCabo VerdeCambodiaCameroonCanadaCaribbeanCentral AmericaChileChinaColombiaCongoCosta RicaCroatiaCubaCzechoslovakiaDenmarkDominicaDominican RepublicEastern AfricaEastern AsiaEcuadorEgyptEl SalvadorEnglandEritreaEthiopiaEuropeFijiFranceGermanyGhanaGreeceGrenadaGuatemalaGuyanaHaitiHondurasHong KongHungaryIndiaIndonesiaIranIraqIrelandIsraelItalyJamaicaJapanJordanKazakhstanKenyaKoreaKuwaitLaosLatin AmericaLatviaLebanonLiberiaLithuaniaMalaysiaMexicoMicronesiaMiddle AfricaMoldovaMoroccoNepalNetherlandsNicaraguaNigeriaNorth AmericaNorth MacedoniaNorthern AfricaNorthern EuropeNorwayOceaniaPakistanPanamaPeruPhilippinesPolandPortugalRomaniaRussiaSaudi ArabiaScotlandSenegalSerbiaSierra LeoneSingaporeSomaliaSouth AfricaSouth AmericaSouth Central AsiaSouth Eastern AsiaSouthern EuropeSpainSri LankaSt. Vincent and the GrenadinesSudanSwedenSwitzerlandSyriaTaiwanThailandTrinidad and TobagoTurkeyUgandaUkraineUruguayUzbekistanVenezuelaVietnamWest IndiesWestern AfricaWestern AsiaWestern EuropeYemenZaireZimbabweAzores
Female Poverty Among 25-34 Year Olds
Income
Poverty
Unemployment
Labor Participation
Family Structure
Vehicle Availability
Education Level
Disability

Female Poverty Among 25-34 Year Olds Comparison

Immigrants from Eastern Europe

Bhutanese

Exceptional
Exceptional
12.0%
FEMALE POVERTY AMONG 25-34 YEAR OLDS
99.6/ 100
METRIC RATING
52nd/ 347
METRIC RANK
11.4%
FEMALE POVERTY AMONG 25-34 YEAR OLDS
99.9/ 100
METRIC RATING
25th/ 347
METRIC RANK

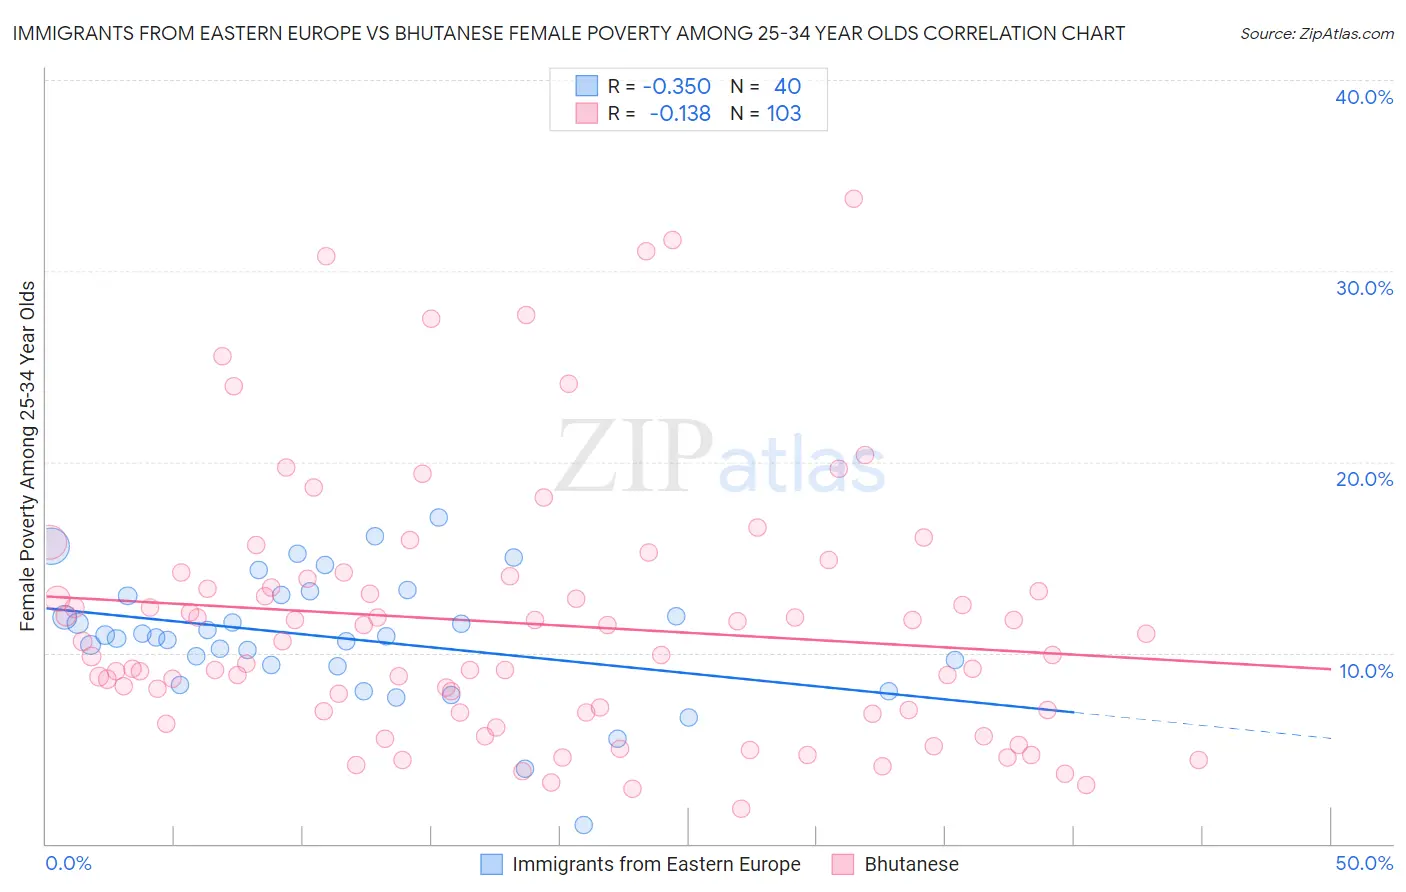
Immigrants from Eastern Europe vs Bhutanese Female Poverty Among 25-34 Year Olds Correlation Chart

The statistical analysis conducted on geographies consisting of 463,335,810 people shows a mild negative correlation between the proportion of Immigrants from Eastern Europe and poverty level among females between the ages 25 and 34 in the United States with a correlation coefficient (R) of -0.350 and weighted average of 12.0%. Similarly, the statistical analysis conducted on geographies consisting of 446,147,907 people shows a poor negative correlation between the proportion of Bhutanese and poverty level among females between the ages 25 and 34 in the United States with a correlation coefficient (R) of -0.138 and weighted average of 11.4%, a difference of 4.7%.
Immigrants from Eastern Europe vs Bhutanese Female Poverty Among 25-34 Year Olds

Female Poverty Among 25-34 Year Olds Correlation Summary

MeasurementImmigrants from Eastern EuropeBhutanese
Minimum0.98%1.8%
Maximum17.1%33.8%
Range16.1%31.9%
Mean10.8%11.5%
Median10.8%9.9%
Interquartile 25% (IQ1)9.3%6.9%
Interquartile 75% (IQ3)13.0%13.9%
Interquartile Range (IQR)3.7%7.0%
Standard Deviation (Sample)3.3%6.8%
Standard Deviation (Population)3.2%6.7%

Similar Demographics by Female Poverty Among 25-34 Year Olds

Demographics Similar to Immigrants from Eastern Europe by Female Poverty Among 25-34 Year Olds

In terms of female poverty among 25-34 year olds, the demographic groups most similar to Immigrants from Eastern Europe are Paraguayan (12.0%, a difference of 0.020%), Immigrants from Croatia (12.0%, a difference of 0.030%), Immigrants from Egypt (12.0%, a difference of 0.040%), Immigrants from Belarus (12.0%, a difference of 0.12%), and Immigrants from Israel (12.0%, a difference of 0.12%).
DemographicsRating | RankFemale Poverty Among 25-34 Year Olds
Macedonians
99.7
/100
|
#45
Exceptional
11.9%
Immigrants | Serbia
99.7
/100
|
#46
Exceptional
11.9%
Koreans
99.6
/100
|
#47
Exceptional
12.0%
Immigrants | Belarus
99.6
/100
|
#48
Exceptional
12.0%
Immigrants | Egypt
99.6
/100
|
#49
Exceptional
12.0%
Immigrants | Croatia
99.6
/100
|
#50
Exceptional
12.0%
Paraguayans
99.6
/100
|
#51
Exceptional
12.0%
Immigrants | Eastern Europe
99.6
/100
|
#52
Exceptional
12.0%
Immigrants | Israel
99.6
/100
|
#53
Exceptional
12.0%
Eastern Europeans
99.6
/100
|
#54
Exceptional
12.0%
Immigrants | Philippines
99.5
/100
|
#55
Exceptional
12.0%
Luxembourgers
99.5
/100
|
#56
Exceptional
12.1%
Jordanians
99.4
/100
|
#57
Exceptional
12.1%
Immigrants | Romania
99.4
/100
|
#58
Exceptional
12.1%
Russians
99.4
/100
|
#59
Exceptional
12.1%

Demographics Similar to Bhutanese by Female Poverty Among 25-34 Year Olds

In terms of female poverty among 25-34 year olds, the demographic groups most similar to Bhutanese are Tongan (11.5%, a difference of 0.15%), Maltese (11.4%, a difference of 0.22%), Bolivian (11.4%, a difference of 0.25%), Asian (11.4%, a difference of 0.31%), and Immigrants from Greece (11.5%, a difference of 0.45%).
DemographicsRating | RankFemale Poverty Among 25-34 Year Olds
Immigrants | Eastern Asia
100.0
/100
|
#18
Exceptional
11.2%
Iranians
100.0
/100
|
#19
Exceptional
11.2%
Okinawans
100.0
/100
|
#20
Exceptional
11.3%
Turks
100.0
/100
|
#21
Exceptional
11.4%
Asians
99.9
/100
|
#22
Exceptional
11.4%
Bolivians
99.9
/100
|
#23
Exceptional
11.4%
Maltese
99.9
/100
|
#24
Exceptional
11.4%
Bhutanese
99.9
/100
|
#25
Exceptional
11.4%
Tongans
99.9
/100
|
#26
Exceptional
11.5%
Immigrants | Greece
99.9
/100
|
#27
Exceptional
11.5%
Immigrants | Pakistan
99.9
/100
|
#28
Exceptional
11.5%
Bulgarians
99.9
/100
|
#29
Exceptional
11.5%
Cypriots
99.9
/100
|
#30
Exceptional
11.5%
Immigrants | Japan
99.9
/100
|
#31
Exceptional
11.6%
Immigrants | Asia
99.9
/100
|
#32
Exceptional
11.6%