Immigrants from Eastern Europe vs Arapaho Child Poverty Under the Age of 5
COMPARE
Immigrants from Eastern Europe
Arapaho
Child Poverty Under the Age of 5
Child Poverty Under the Age of 5 Comparison
Immigrants from Eastern Europe
Arapaho
15.1%
CHILD POVERTY UNDER THE AGE OF 5
99.1/ 100
METRIC RATING
62nd/ 347
METRIC RANK
23.1%
CHILD POVERTY UNDER THE AGE OF 5
0.0/ 100
METRIC RATING
315th/ 347
METRIC RANK
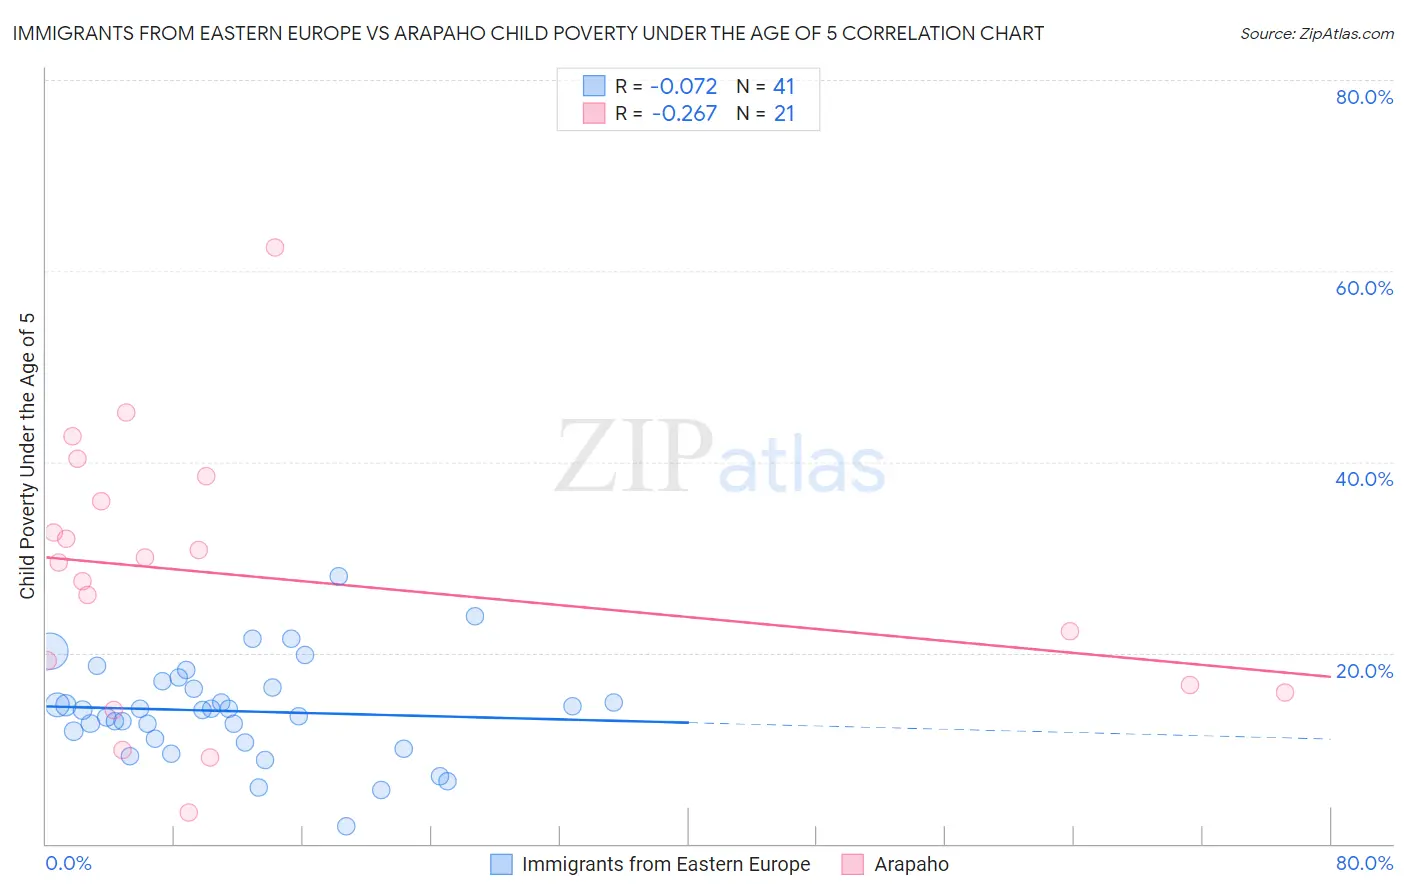
Immigrants from Eastern Europe vs Arapaho Child Poverty Under the Age of 5 Correlation Chart
The statistical analysis conducted on geographies consisting of 448,928,645 people shows a slight negative correlation between the proportion of Immigrants from Eastern Europe and poverty level among children under the age of 5 in the United States with a correlation coefficient (R) of -0.072 and weighted average of 15.1%. Similarly, the statistical analysis conducted on geographies consisting of 29,632,672 people shows a weak negative correlation between the proportion of Arapaho and poverty level among children under the age of 5 in the United States with a correlation coefficient (R) of -0.267 and weighted average of 23.1%, a difference of 52.8%.
Child Poverty Under the Age of 5 Correlation Summary
| Measurement | Immigrants from Eastern Europe | Arapaho |
| Minimum | 1.8% | 3.3% |
| Maximum | 28.1% | 62.5% |
| Range | 26.2% | 59.2% |
| Mean | 13.9% | 27.8% |
| Median | 13.9% | 29.5% |
| Interquartile 25% (IQ1) | 10.8% | 16.3% |
| Interquartile 75% (IQ3) | 16.7% | 37.2% |
| Interquartile Range (IQR) | 5.9% | 20.9% |
| Standard Deviation (Sample) | 5.2% | 14.1% |
| Standard Deviation (Population) | 5.1% | 13.7% |
Similar Demographics by Child Poverty Under the Age of 5
Demographics Similar to Immigrants from Eastern Europe by Child Poverty Under the Age of 5
In terms of child poverty under the age of 5, the demographic groups most similar to Immigrants from Eastern Europe are Immigrants from Poland (15.1%, a difference of 0.12%), Immigrants from Europe (15.1%, a difference of 0.13%), Immigrants from Romania (15.2%, a difference of 0.15%), Immigrants from Fiji (15.2%, a difference of 0.18%), and Immigrants from Scotland (15.2%, a difference of 0.29%).
| Demographics | Rating | Rank | Child Poverty Under the Age of 5 |
| Danes | 99.4 /100 | #55 | Exceptional 14.9% |
| Immigrants | Pakistan | 99.4 /100 | #56 | Exceptional 14.9% |
| Egyptians | 99.4 /100 | #57 | Exceptional 14.9% |
| Swedes | 99.4 /100 | #58 | Exceptional 15.0% |
| Paraguayans | 99.4 /100 | #59 | Exceptional 15.0% |
| Immigrants | Russia | 99.3 /100 | #60 | Exceptional 15.0% |
| Immigrants | Poland | 99.1 /100 | #61 | Exceptional 15.1% |
| Immigrants | Eastern Europe | 99.1 /100 | #62 | Exceptional 15.1% |
| Immigrants | Europe | 99.1 /100 | #63 | Exceptional 15.1% |
| Immigrants | Romania | 99.1 /100 | #64 | Exceptional 15.2% |
| Immigrants | Fiji | 99.0 /100 | #65 | Exceptional 15.2% |
| Immigrants | Scotland | 99.0 /100 | #66 | Exceptional 15.2% |
| Greeks | 99.0 /100 | #67 | Exceptional 15.2% |
| Zimbabweans | 99.0 /100 | #68 | Exceptional 15.2% |
| Lithuanians | 99.0 /100 | #69 | Exceptional 15.2% |
Demographics Similar to Arapaho by Child Poverty Under the Age of 5
In terms of child poverty under the age of 5, the demographic groups most similar to Arapaho are Yakama (23.1%, a difference of 0.12%), U.S. Virgin Islander (23.0%, a difference of 0.56%), Menominee (23.3%, a difference of 0.62%), Bahamian (23.0%, a difference of 0.65%), and Honduran (23.0%, a difference of 0.70%).
| Demographics | Rating | Rank | Child Poverty Under the Age of 5 |
| Immigrants | Dominica | 0.0 /100 | #308 | Tragic 22.7% |
| Houma | 0.0 /100 | #309 | Tragic 22.7% |
| Africans | 0.0 /100 | #310 | Tragic 22.8% |
| Seminole | 0.0 /100 | #311 | Tragic 22.8% |
| Hondurans | 0.0 /100 | #312 | Tragic 23.0% |
| Bahamians | 0.0 /100 | #313 | Tragic 23.0% |
| U.S. Virgin Islanders | 0.0 /100 | #314 | Tragic 23.0% |
| Arapaho | 0.0 /100 | #315 | Tragic 23.1% |
| Yakama | 0.0 /100 | #316 | Tragic 23.1% |
| Menominee | 0.0 /100 | #317 | Tragic 23.3% |
| Dutch West Indians | 0.0 /100 | #318 | Tragic 23.3% |
| Chippewa | 0.0 /100 | #319 | Tragic 23.4% |
| Choctaw | 0.0 /100 | #320 | Tragic 23.5% |
| Immigrants | Honduras | 0.0 /100 | #321 | Tragic 23.5% |
| Ute | 0.0 /100 | #322 | Tragic 23.5% |