Immigrants from Eastern Africa vs Immigrants from Northern Europe Poverty

COMPARE

Immigrants from Eastern Africa
Race
Ancestry
AfghanAfricanAlaska NativeAlaskan AthabascanAlbanianAleutAlsatianAmericanApacheArabArapahoArgentineanArmenianAssyrian/Chaldean/SyriacAustralianAustrianBahamianBangladeshiBarbadianBasqueBelgianBelizeanBermudanBhutaneseBlackfeetBolivianBrazilianBritishBritish West IndianBulgarianBurmeseCajunCambodianCanadianCape VerdeanCarpatho RusynCelticCentral AmericanCentral American IndianCherokeeCheyenneChickasawChileanChineseChippewaChoctawColombianColvilleComancheCosta RicanCreeCreekCroatianCrowCubanCypriotCzechCzechoslovakianDanishDelawareDominicanDutchDutch West IndianEastern EuropeanEcuadorianEgyptianEnglishEstonianEthiopianEuropeanFijianFilipinoFinnishFrenchFrench American IndianFrench CanadianGermanGerman RussianGhanaianGreekGuamanian/ChamorroGuatemalanGuyaneseHaitianHmongHonduranHopiHoumaHungarianIcelanderIndian (Asian)IndonesianInupiatIranianIraqiIrishIroquoisIsraeliItalianJamaicanJapaneseJordanianKenyanKiowaKoreanLaotianLatvianLebaneseLiberianLithuanianLumbeeLuxembourgerMacedonianMalaysianMalteseMarshalleseMenomineeMexicanMexican American IndianMongolianMoroccanNative HawaiianNavajoNepaleseNew ZealanderNicaraguanNigerianNorthern EuropeanNorwegianOkinawanOsageOttawaPaiutePakistaniPalestinianPanamanianParaguayanPennsylvania GermanPeruvianPimaPolishPortuguesePotawatomiPuebloPuerto RicanPuget Sound SalishRomanianRussianSalvadoranSamoanScandinavianScotch-IrishScottishSeminoleSenegaleseSerbianShoshoneSierra LeoneanSiouxSlavicSlovakSloveneSomaliSouth AfricanSouth AmericanSouth American IndianSoviet UnionSpaniardSpanishSpanish AmericanSpanish American IndianSri LankanSubsaharan AfricanSudaneseSwedishSwissSyrianTaiwaneseThaiTlingit-HaidaTohono O'OdhamTonganTrinidadian and TobagonianTsimshianTurkishU.S. Virgin IslanderUgandanUkrainianUruguayanUteVenezuelanVietnameseWelshWest IndianYakamaYaquiYugoslavianYumanYup'ikZimbabwean
Immigration
NonimmigrantsImmigrantsAfghanistanAfricaAlbaniaArgentinaArmeniaAsiaAustraliaAustriaBahamasBangladeshBarbadosBelarusBelgiumBelizeBoliviaBosnia and HerzegovinaBrazilBulgariaBurma/MyanmarCabo VerdeCambodiaCameroonCanadaCaribbeanCentral AmericaChileChinaColombiaCongoCosta RicaCroatiaCubaCzechoslovakiaDenmarkDominicaDominican RepublicEastern AfricaEastern AsiaEastern EuropeEcuadorEgyptEl SalvadorEnglandEritreaEthiopiaEuropeFijiFranceGermanyGhanaGreeceGrenadaGuatemalaGuyanaHaitiHondurasHong KongHungaryIndiaIndonesiaIranIraqIrelandIsraelItalyJamaicaJapanJordanKazakhstanKenyaKoreaKuwaitLaosLatin AmericaLatviaLebanonLiberiaLithuaniaMalaysiaMexicoMicronesiaMiddle AfricaMoldovaMoroccoNepalNetherlandsNicaraguaNigeriaNorth AmericaNorth MacedoniaNorthern AfricaNorwayOceaniaPakistanPanamaPeruPhilippinesPolandPortugalRomaniaRussiaSaudi ArabiaScotlandSenegalSerbiaSierra LeoneSingaporeSomaliaSouth AfricaSouth AmericaSouth Central AsiaSouth Eastern AsiaSouthern EuropeSpainSri LankaSt. Vincent and the GrenadinesSudanSwedenSwitzerlandSyriaTaiwanThailandTrinidad and TobagoTurkeyUgandaUkraineUruguayUzbekistanVenezuelaVietnamWest IndiesWestern AfricaWestern AsiaWestern EuropeYemenZaireZimbabweAzores
Immigrants from Northern Europe
Race
Ancestry
AfghanAfricanAlaska NativeAlaskan AthabascanAlbanianAleutAlsatianAmericanApacheArabArapahoArgentineanArmenianAssyrian/Chaldean/SyriacAustralianAustrianBahamianBangladeshiBarbadianBasqueBelgianBelizeanBermudanBhutaneseBlackfeetBolivianBrazilianBritishBritish West IndianBulgarianBurmeseCajunCambodianCanadianCape VerdeanCarpatho RusynCelticCentral AmericanCentral American IndianCherokeeCheyenneChickasawChileanChineseChippewaChoctawColombianColvilleComancheCosta RicanCreeCreekCroatianCrowCubanCypriotCzechCzechoslovakianDanishDelawareDominicanDutchDutch West IndianEastern EuropeanEcuadorianEgyptianEnglishEstonianEthiopianEuropeanFijianFilipinoFinnishFrenchFrench American IndianFrench CanadianGermanGerman RussianGhanaianGreekGuamanian/ChamorroGuatemalanGuyaneseHaitianHmongHonduranHopiHoumaHungarianIcelanderIndian (Asian)IndonesianInupiatIranianIraqiIrishIroquoisIsraeliItalianJamaicanJapaneseJordanianKenyanKiowaKoreanLaotianLatvianLebaneseLiberianLithuanianLumbeeLuxembourgerMacedonianMalaysianMalteseMarshalleseMenomineeMexicanMexican American IndianMongolianMoroccanNative HawaiianNavajoNepaleseNew ZealanderNicaraguanNigerianNorthern EuropeanNorwegianOkinawanOsageOttawaPaiutePakistaniPalestinianPanamanianParaguayanPennsylvania GermanPeruvianPimaPolishPortuguesePotawatomiPuebloPuerto RicanPuget Sound SalishRomanianRussianSalvadoranSamoanScandinavianScotch-IrishScottishSeminoleSenegaleseSerbianShoshoneSierra LeoneanSiouxSlavicSlovakSloveneSomaliSouth AfricanSouth AmericanSouth American IndianSoviet UnionSpaniardSpanishSpanish AmericanSpanish American IndianSri LankanSubsaharan AfricanSudaneseSwedishSwissSyrianTaiwaneseThaiTlingit-HaidaTohono O'OdhamTonganTrinidadian and TobagonianTsimshianTurkishU.S. Virgin IslanderUgandanUkrainianUruguayanUteVenezuelanVietnameseWelshWest IndianYakamaYaquiYugoslavianYumanYup'ikZimbabwean
Immigration
NonimmigrantsImmigrantsAfghanistanAfricaAlbaniaArgentinaArmeniaAsiaAustraliaAustriaBahamasBangladeshBarbadosBelarusBelgiumBelizeBoliviaBosnia and HerzegovinaBrazilBulgariaBurma/MyanmarCabo VerdeCambodiaCameroonCanadaCaribbeanCentral AmericaChileChinaColombiaCongoCosta RicaCroatiaCubaCzechoslovakiaDenmarkDominicaDominican RepublicEastern AsiaEastern EuropeEcuadorEgyptEl SalvadorEnglandEritreaEthiopiaEuropeFijiFranceGermanyGhanaGreeceGrenadaGuatemalaGuyanaHaitiHondurasHong KongHungaryIndiaIndonesiaIranIraqIrelandIsraelItalyJamaicaJapanJordanKazakhstanKenyaKoreaKuwaitLaosLatin AmericaLatviaLebanonLiberiaLithuaniaMalaysiaMexicoMicronesiaMiddle AfricaMoldovaMoroccoNepalNetherlandsNicaraguaNigeriaNorth AmericaNorth MacedoniaNorthern AfricaNorthern EuropeNorwayOceaniaPakistanPanamaPeruPhilippinesPolandPortugalRomaniaRussiaSaudi ArabiaScotlandSenegalSerbiaSierra LeoneSingaporeSomaliaSouth AfricaSouth AmericaSouth Central AsiaSouth Eastern AsiaSouthern EuropeSpainSri LankaSt. Vincent and the GrenadinesSudanSwedenSwitzerlandSyriaTaiwanThailandTrinidad and TobagoTurkeyUgandaUkraineUruguayUzbekistanVenezuelaVietnamWest IndiesWestern AfricaWestern AsiaWestern EuropeYemenZaireZimbabweAzores
Poverty
Income
Poverty
Unemployment
Labor Participation
Family Structure
Vehicle Availability
Education Level
Disability

Poverty Comparison

Immigrants from Eastern Africa

Immigrants from Northern Europe

Tragic
Exceptional
13.1%
POVERTY
7.0/ 100
METRIC RATING
206th/ 347
METRIC RANK
10.7%
POVERTY
99.6/ 100
METRIC RATING
27th/ 347
METRIC RANK

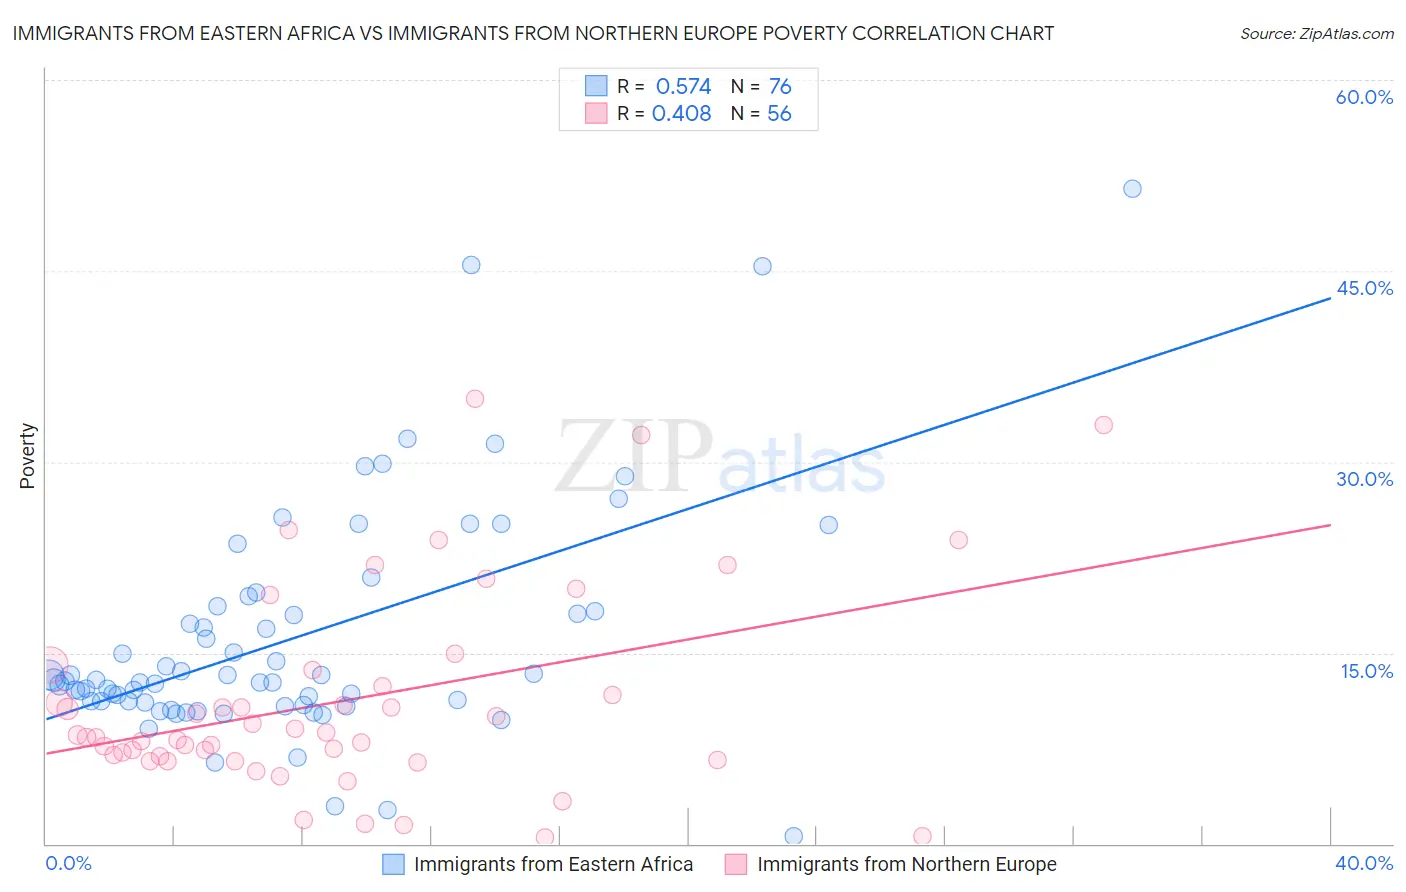
Immigrants from Eastern Africa vs Immigrants from Northern Europe Poverty Correlation Chart

The statistical analysis conducted on geographies consisting of 354,926,881 people shows a substantial positive correlation between the proportion of Immigrants from Eastern Africa and poverty level in the United States with a correlation coefficient (R) of 0.574 and weighted average of 13.1%. Similarly, the statistical analysis conducted on geographies consisting of 476,900,751 people shows a moderate positive correlation between the proportion of Immigrants from Northern Europe and poverty level in the United States with a correlation coefficient (R) of 0.408 and weighted average of 10.7%, a difference of 22.3%.
Immigrants from Eastern Africa vs Immigrants from Northern Europe Poverty

Poverty Correlation Summary

MeasurementImmigrants from Eastern AfricaImmigrants from Northern Europe
Minimum0.57%0.52%
Maximum51.5%35.0%
Range50.9%34.5%
Mean16.1%11.2%
Median12.8%8.5%
Interquartile 25% (IQ1)11.1%6.7%
Interquartile 75% (IQ3)18.5%13.0%
Interquartile Range (IQR)7.4%6.3%
Standard Deviation (Sample)9.2%7.9%
Standard Deviation (Population)9.1%7.9%

Similar Demographics by Poverty

Demographics Similar to Immigrants from Eastern Africa by Poverty

In terms of poverty, the demographic groups most similar to Immigrants from Eastern Africa are Panamanian (13.1%, a difference of 0.12%), Ugandan (13.1%, a difference of 0.27%), Malaysian (13.1%, a difference of 0.30%), Immigrants from the Azores (13.1%, a difference of 0.34%), and Moroccan (13.2%, a difference of 0.69%).
DemographicsRating | RankPoverty
Immigrants | Kenya
17.5
/100
|
#199
Poor
12.8%
Spaniards
16.5
/100
|
#200
Poor
12.8%
Immigrants | Uganda
16.5
/100
|
#201
Poor
12.8%
Immigrants | Uruguay
15.6
/100
|
#202
Poor
12.8%
Hmong
15.0
/100
|
#203
Poor
12.8%
Immigrants | Western Asia
14.1
/100
|
#204
Poor
12.9%
Tsimshian
9.2
/100
|
#205
Tragic
13.0%
Immigrants | Eastern Africa
7.0
/100
|
#206
Tragic
13.1%
Panamanians
6.6
/100
|
#207
Tragic
13.1%
Ugandans
6.2
/100
|
#208
Tragic
13.1%
Malaysians
6.1
/100
|
#209
Tragic
13.1%
Immigrants | Azores
6.1
/100
|
#210
Tragic
13.1%
Moroccans
5.2
/100
|
#211
Tragic
13.2%
Immigrants | Immigrants
4.3
/100
|
#212
Tragic
13.2%
Immigrants | Panama
4.1
/100
|
#213
Tragic
13.3%

Demographics Similar to Immigrants from Northern Europe by Poverty

In terms of poverty, the demographic groups most similar to Immigrants from Northern Europe are Immigrants from Korea (10.7%, a difference of 0.070%), Greek (10.7%, a difference of 0.16%), Danish (10.7%, a difference of 0.17%), Polish (10.7%, a difference of 0.25%), and Iranian (10.7%, a difference of 0.34%).
DemographicsRating | RankPoverty
Immigrants | North Macedonia
99.7
/100
|
#20
Exceptional
10.6%
Luxembourgers
99.7
/100
|
#21
Exceptional
10.6%
Eastern Europeans
99.7
/100
|
#22
Exceptional
10.6%
Swedes
99.7
/100
|
#23
Exceptional
10.6%
Italians
99.7
/100
|
#24
Exceptional
10.6%
Croatians
99.6
/100
|
#25
Exceptional
10.6%
Burmese
99.6
/100
|
#26
Exceptional
10.7%
Immigrants | Northern Europe
99.6
/100
|
#27
Exceptional
10.7%
Immigrants | Korea
99.5
/100
|
#28
Exceptional
10.7%
Greeks
99.5
/100
|
#29
Exceptional
10.7%
Danes
99.5
/100
|
#30
Exceptional
10.7%
Poles
99.5
/100
|
#31
Exceptional
10.7%
Iranians
99.5
/100
|
#32
Exceptional
10.7%
Macedonians
99.4
/100
|
#33
Exceptional
10.8%
Immigrants | Poland
99.4
/100
|
#34
Exceptional
10.8%