Immigrants from Dominican Republic vs Puget Sound Salish Seniors Poverty Over the Age of 75
COMPARE
Immigrants from Dominican Republic
Puget Sound Salish
Seniors Poverty Over the Age of 75
Seniors Poverty Over the Age of 75 Comparison
Immigrants from Dominican Republic
Puget Sound Salish
20.1%
SENIORS POVERTY OVER THE AGE OF 75
0.0/ 100
METRIC RATING
345th/ 347
METRIC RANK
10.8%
SENIORS POVERTY OVER THE AGE OF 75
99.7/ 100
METRIC RATING
33rd/ 347
METRIC RANK
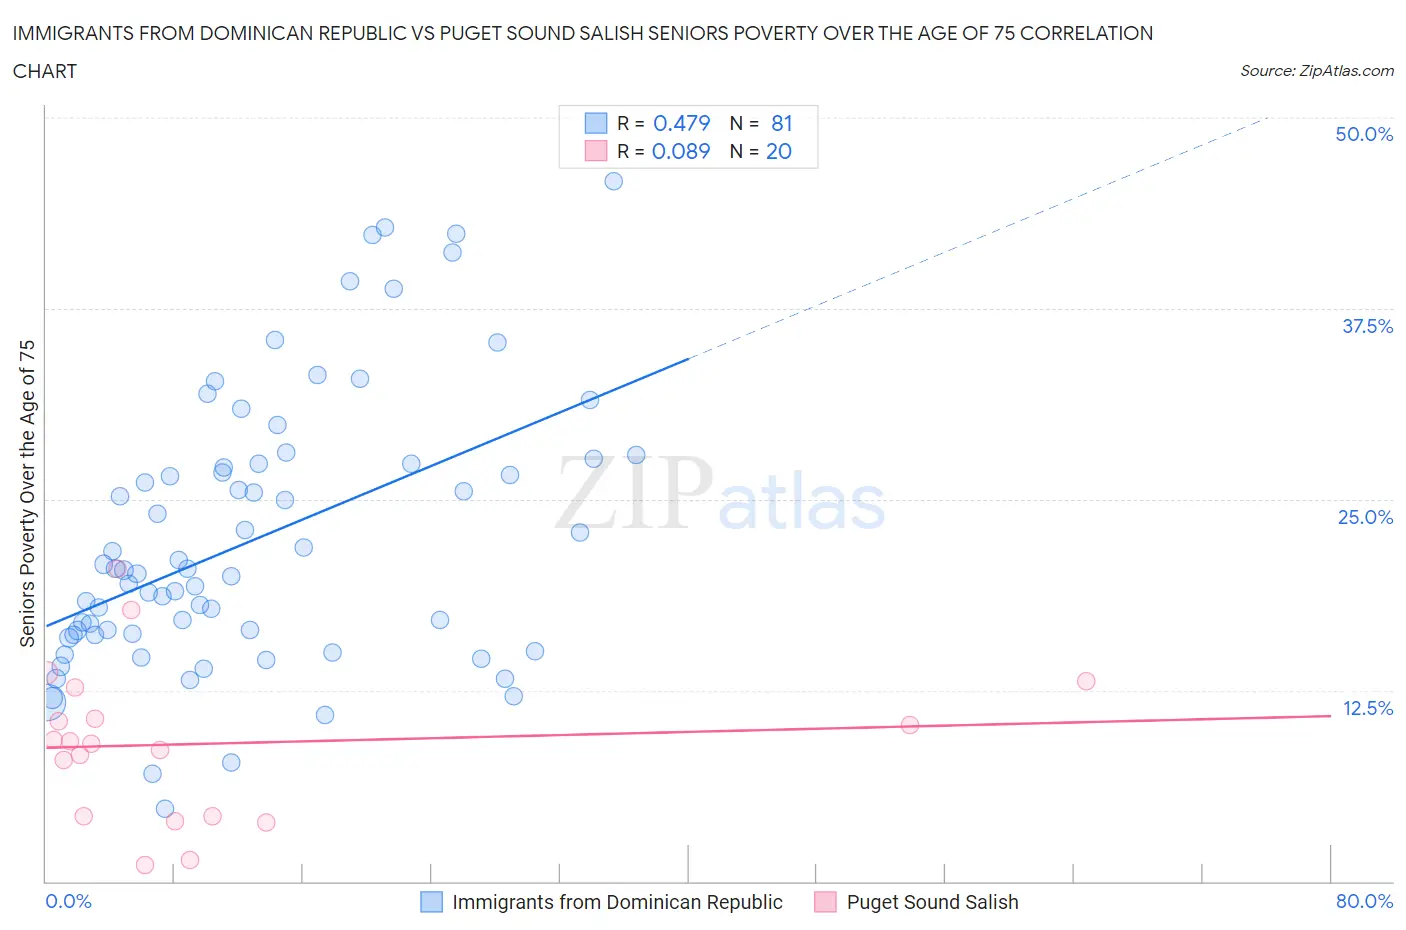
Immigrants from Dominican Republic vs Puget Sound Salish Seniors Poverty Over the Age of 75 Correlation Chart
The statistical analysis conducted on geographies consisting of 272,640,242 people shows a moderate positive correlation between the proportion of Immigrants from Dominican Republic and poverty level among seniors over the age of 75 in the United States with a correlation coefficient (R) of 0.479 and weighted average of 20.1%. Similarly, the statistical analysis conducted on geographies consisting of 45,967,843 people shows a slight positive correlation between the proportion of Puget Sound Salish and poverty level among seniors over the age of 75 in the United States with a correlation coefficient (R) of 0.089 and weighted average of 10.8%, a difference of 86.5%.
Seniors Poverty Over the Age of 75 Correlation Summary
| Measurement | Immigrants from Dominican Republic | Puget Sound Salish |
| Minimum | 4.8% | 1.0% |
| Maximum | 45.8% | 20.4% |
| Range | 41.1% | 19.4% |
| Mean | 22.4% | 9.0% |
| Median | 20.3% | 9.1% |
| Interquartile 25% (IQ1) | 16.1% | 4.2% |
| Interquartile 75% (IQ3) | 27.3% | 11.7% |
| Interquartile Range (IQR) | 11.2% | 7.4% |
| Standard Deviation (Sample) | 9.0% | 5.1% |
| Standard Deviation (Population) | 8.9% | 4.9% |
Similar Demographics by Seniors Poverty Over the Age of 75
Demographics Similar to Immigrants from Dominican Republic by Seniors Poverty Over the Age of 75
In terms of seniors poverty over the age of 75, the demographic groups most similar to Immigrants from Dominican Republic are Immigrants from Cuba (19.9%, a difference of 0.78%), Lumbee (19.7%, a difference of 1.6%), Dominican (19.6%, a difference of 2.2%), Navajo (19.4%, a difference of 3.5%), and Tohono O'odham (19.1%, a difference of 4.8%).
| Demographics | Rating | Rank | Seniors Poverty Over the Age of 75 |
| Immigrants | Nicaragua | 0.0 /100 | #333 | Tragic 17.6% |
| Immigrants | Grenada | 0.0 /100 | #334 | Tragic 17.8% |
| Cubans | 0.0 /100 | #335 | Tragic 18.0% |
| Immigrants | Caribbean | 0.0 /100 | #336 | Tragic 18.2% |
| Yakama | 0.0 /100 | #337 | Tragic 18.3% |
| Immigrants | Cabo Verde | 0.0 /100 | #338 | Tragic 18.5% |
| Hopi | 0.0 /100 | #339 | Tragic 18.9% |
| Tohono O'odham | 0.0 /100 | #340 | Tragic 19.1% |
| Navajo | 0.0 /100 | #341 | Tragic 19.4% |
| Dominicans | 0.0 /100 | #342 | Tragic 19.6% |
| Lumbee | 0.0 /100 | #343 | Tragic 19.7% |
| Immigrants | Cuba | 0.0 /100 | #344 | Tragic 19.9% |
| Immigrants | Dominican Republic | 0.0 /100 | #345 | Tragic 20.1% |
| Puerto Ricans | 0.0 /100 | #346 | Tragic 23.2% |
| Pima | 0.0 /100 | #347 | Tragic 23.9% |
Demographics Similar to Puget Sound Salish by Seniors Poverty Over the Age of 75
In terms of seniors poverty over the age of 75, the demographic groups most similar to Puget Sound Salish are Italian (10.8%, a difference of 0.050%), British (10.7%, a difference of 0.060%), Marshallese (10.7%, a difference of 0.19%), Swiss (10.7%, a difference of 0.38%), and Luxembourger (10.8%, a difference of 0.44%).
| Demographics | Rating | Rank | Seniors Poverty Over the Age of 75 |
| Bulgarians | 99.8 /100 | #26 | Exceptional 10.7% |
| Northern Europeans | 99.8 /100 | #27 | Exceptional 10.7% |
| Irish | 99.8 /100 | #28 | Exceptional 10.7% |
| Assyrians/Chaldeans/Syriacs | 99.8 /100 | #29 | Exceptional 10.7% |
| Swiss | 99.7 /100 | #30 | Exceptional 10.7% |
| Marshallese | 99.7 /100 | #31 | Exceptional 10.7% |
| British | 99.7 /100 | #32 | Exceptional 10.7% |
| Puget Sound Salish | 99.7 /100 | #33 | Exceptional 10.8% |
| Italians | 99.7 /100 | #34 | Exceptional 10.8% |
| Luxembourgers | 99.6 /100 | #35 | Exceptional 10.8% |
| Scotch-Irish | 99.6 /100 | #36 | Exceptional 10.8% |
| Latvians | 99.6 /100 | #37 | Exceptional 10.8% |
| Finns | 99.6 /100 | #38 | Exceptional 10.8% |
| Czechoslovakians | 99.4 /100 | #39 | Exceptional 10.9% |
| Thais | 99.4 /100 | #40 | Exceptional 10.9% |