Immigrants from Dominican Republic vs Puerto Rican Child Poverty Among Girls Under 16
COMPARE
Immigrants from Dominican Republic
Puerto Rican
Child Poverty Among Girls Under 16
Child Poverty Among Girls Under 16 Comparison
Immigrants from Dominican Republic
Puerto Ricans
23.8%
CHILD POVERTY AMONG GIRLS UNDER 16
0.0/ 100
METRIC RATING
330th/ 347
METRIC RANK
32.7%
CHILD POVERTY AMONG GIRLS UNDER 16
0.0/ 100
METRIC RATING
347th/ 347
METRIC RANK
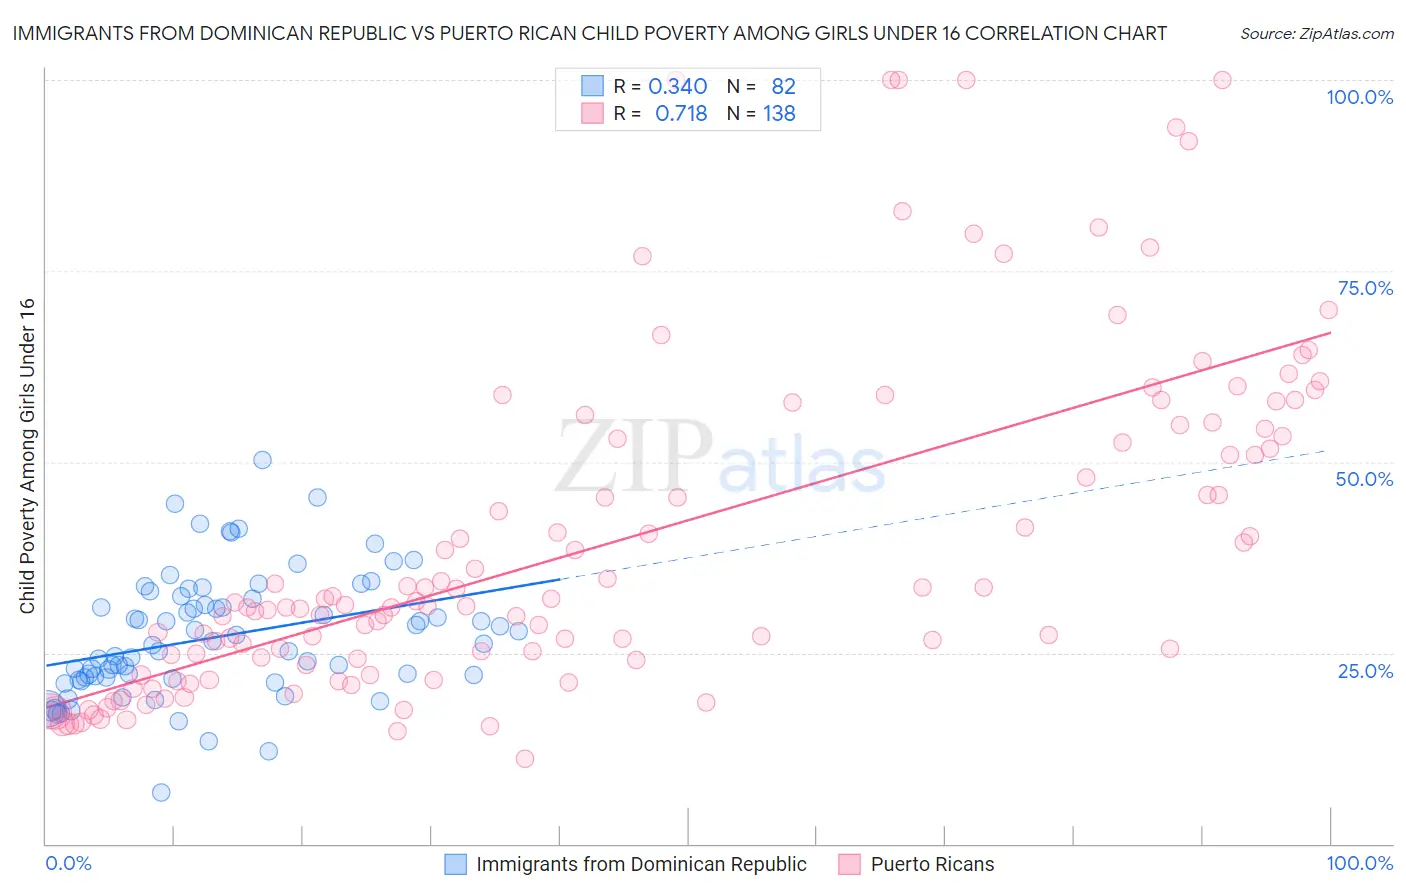
Immigrants from Dominican Republic vs Puerto Rican Child Poverty Among Girls Under 16 Correlation Chart
The statistical analysis conducted on geographies consisting of 271,039,828 people shows a mild positive correlation between the proportion of Immigrants from Dominican Republic and poverty level among girls under the age of 16 in the United States with a correlation coefficient (R) of 0.340 and weighted average of 23.8%. Similarly, the statistical analysis conducted on geographies consisting of 513,321,641 people shows a strong positive correlation between the proportion of Puerto Ricans and poverty level among girls under the age of 16 in the United States with a correlation coefficient (R) of 0.718 and weighted average of 32.7%, a difference of 37.2%.
Child Poverty Among Girls Under 16 Correlation Summary
| Measurement | Immigrants from Dominican Republic | Puerto Rican |
| Minimum | 6.6% | 11.1% |
| Maximum | 50.3% | 100.0% |
| Range | 43.6% | 88.9% |
| Mean | 27.0% | 39.4% |
| Median | 26.1% | 31.2% |
| Interquartile 25% (IQ1) | 21.7% | 24.1% |
| Interquartile 75% (IQ3) | 32.1% | 53.3% |
| Interquartile Range (IQR) | 10.4% | 29.2% |
| Standard Deviation (Sample) | 8.1% | 21.8% |
| Standard Deviation (Population) | 8.1% | 21.7% |
Demographics Similar to Immigrants from Dominican Republic and Puerto Ricans by Child Poverty Among Girls Under 16
In terms of child poverty among girls under 16, the demographic groups most similar to Immigrants from Dominican Republic are Apache (23.8%, a difference of 0.050%), Kiowa (23.7%, a difference of 0.54%), Dominican (23.7%, a difference of 0.65%), Native/Alaskan (24.0%, a difference of 0.91%), and Black/African American (24.7%, a difference of 3.5%). Similarly, the demographic groups most similar to Puerto Ricans are Tohono O'odham (31.6%, a difference of 3.4%), Lumbee (30.7%, a difference of 6.4%), Navajo (30.5%, a difference of 7.2%), Immigrants from Yemen (29.5%, a difference of 10.8%), and Pima (28.2%, a difference of 15.8%).
| Demographics | Rating | Rank | Child Poverty Among Girls Under 16 |
| Dominicans | 0.0 /100 | #328 | Tragic 23.7% |
| Kiowa | 0.0 /100 | #329 | Tragic 23.7% |
| Immigrants | Dominican Republic | 0.0 /100 | #330 | Tragic 23.8% |
| Apache | 0.0 /100 | #331 | Tragic 23.8% |
| Natives/Alaskans | 0.0 /100 | #332 | Tragic 24.0% |
| Blacks/African Americans | 0.0 /100 | #333 | Tragic 24.7% |
| Menominee | 0.0 /100 | #334 | Tragic 25.0% |
| Pueblo | 0.0 /100 | #335 | Tragic 25.2% |
| Sioux | 0.0 /100 | #336 | Tragic 25.6% |
| Yup'ik | 0.0 /100 | #337 | Tragic 25.8% |
| Cheyenne | 0.0 /100 | #338 | Tragic 26.3% |
| Crow | 0.0 /100 | #339 | Tragic 26.4% |
| Yuman | 0.0 /100 | #340 | Tragic 27.1% |
| Hopi | 0.0 /100 | #341 | Tragic 27.9% |
| Pima | 0.0 /100 | #342 | Tragic 28.2% |
| Immigrants | Yemen | 0.0 /100 | #343 | Tragic 29.5% |
| Navajo | 0.0 /100 | #344 | Tragic 30.5% |
| Lumbee | 0.0 /100 | #345 | Tragic 30.7% |
| Tohono O'odham | 0.0 /100 | #346 | Tragic 31.6% |
| Puerto Ricans | 0.0 /100 | #347 | Tragic 32.7% |