Immigrants from Dominican Republic vs Immigrants from South America Male Poverty
COMPARE
Immigrants from Dominican Republic
Immigrants from South America
Male Poverty
Male Poverty Comparison
Immigrants from Dominican Republic
Immigrants from South America
16.2%
MALE POVERTY
0.0/ 100
METRIC RATING
330th/ 347
METRIC RANK
11.3%
MALE POVERTY
36.9/ 100
METRIC RATING
184th/ 347
METRIC RANK
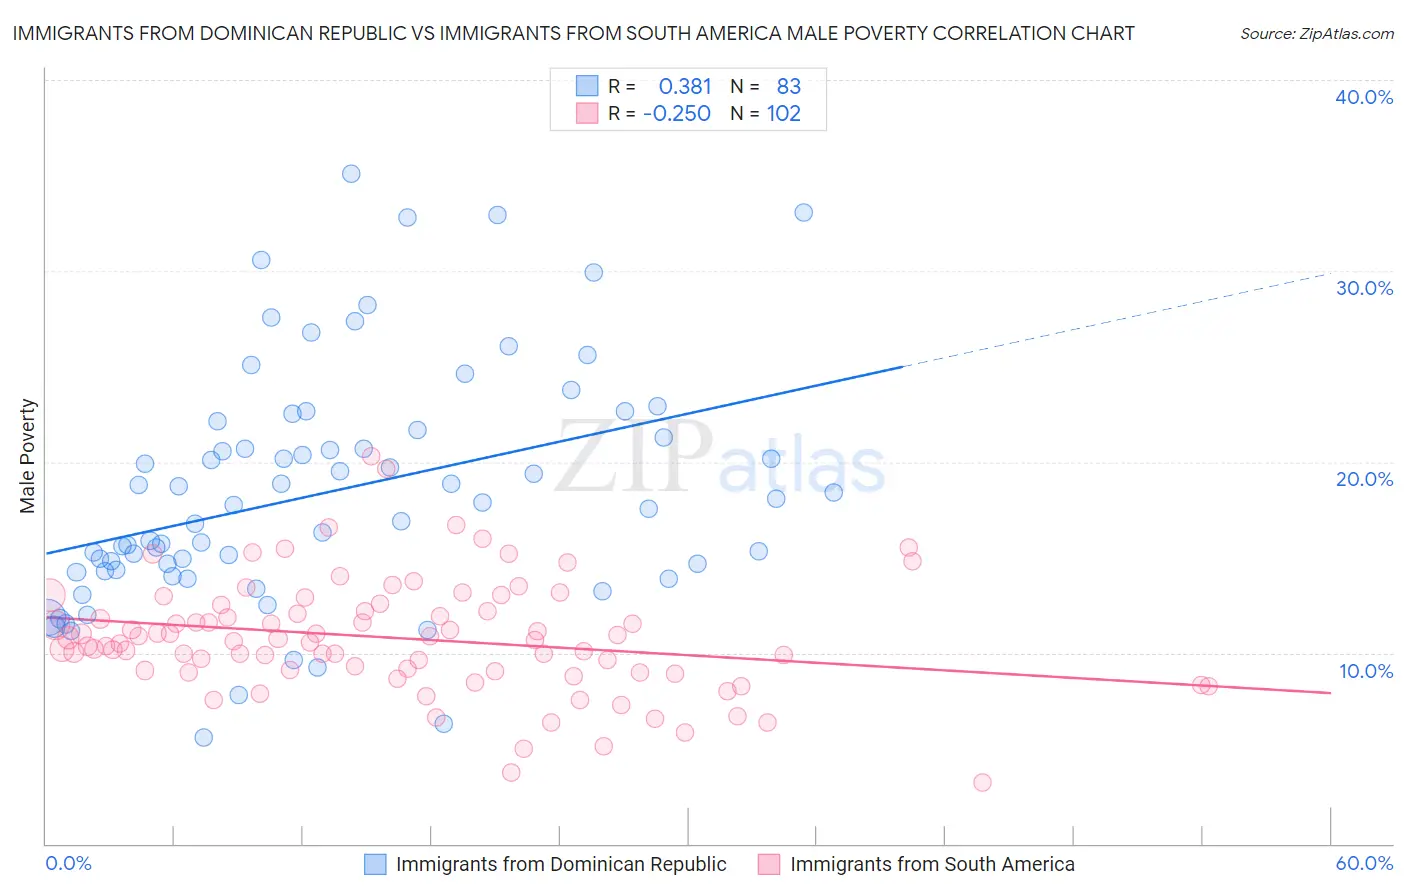
Immigrants from Dominican Republic vs Immigrants from South America Male Poverty Correlation Chart
The statistical analysis conducted on geographies consisting of 274,910,584 people shows a mild positive correlation between the proportion of Immigrants from Dominican Republic and poverty level among males in the United States with a correlation coefficient (R) of 0.381 and weighted average of 16.2%. Similarly, the statistical analysis conducted on geographies consisting of 485,658,265 people shows a weak negative correlation between the proportion of Immigrants from South America and poverty level among males in the United States with a correlation coefficient (R) of -0.250 and weighted average of 11.3%, a difference of 42.8%.
Male Poverty Correlation Summary
| Measurement | Immigrants from Dominican Republic | Immigrants from South America |
| Minimum | 5.5% | 3.2% |
| Maximum | 35.1% | 20.3% |
| Range | 29.5% | 17.1% |
| Mean | 18.4% | 10.8% |
| Median | 17.7% | 10.6% |
| Interquartile 25% (IQ1) | 14.2% | 9.1% |
| Interquartile 75% (IQ3) | 21.7% | 12.2% |
| Interquartile Range (IQR) | 7.5% | 3.1% |
| Standard Deviation (Sample) | 6.2% | 3.0% |
| Standard Deviation (Population) | 6.2% | 3.0% |
Similar Demographics by Male Poverty
Demographics Similar to Immigrants from Dominican Republic by Male Poverty
In terms of male poverty, the demographic groups most similar to Immigrants from Dominican Republic are Ute (16.2%, a difference of 0.34%), Dominican (16.1%, a difference of 0.65%), Black/African American (15.8%, a difference of 2.4%), Paiute (15.8%, a difference of 2.4%), and Houma (16.7%, a difference of 3.3%).
| Demographics | Rating | Rank | Male Poverty |
| Colville | 0.0 /100 | #323 | Tragic 15.2% |
| Menominee | 0.0 /100 | #324 | Tragic 15.3% |
| Yakama | 0.0 /100 | #325 | Tragic 15.3% |
| Central American Indians | 0.0 /100 | #326 | Tragic 15.3% |
| Paiute | 0.0 /100 | #327 | Tragic 15.8% |
| Blacks/African Americans | 0.0 /100 | #328 | Tragic 15.8% |
| Dominicans | 0.0 /100 | #329 | Tragic 16.1% |
| Immigrants | Dominican Republic | 0.0 /100 | #330 | Tragic 16.2% |
| Ute | 0.0 /100 | #331 | Tragic 16.2% |
| Houma | 0.0 /100 | #332 | Tragic 16.7% |
| Natives/Alaskans | 0.0 /100 | #333 | Tragic 16.9% |
| Cheyenne | 0.0 /100 | #334 | Tragic 17.6% |
| Apache | 0.0 /100 | #335 | Tragic 17.7% |
| Pueblo | 0.0 /100 | #336 | Tragic 18.5% |
| Sioux | 0.0 /100 | #337 | Tragic 18.7% |
Demographics Similar to Immigrants from South America by Male Poverty
In terms of male poverty, the demographic groups most similar to Immigrants from South America are Kenyan (11.3%, a difference of 0.16%), Mongolian (11.3%, a difference of 0.22%), Immigrants from Costa Rica (11.3%, a difference of 0.27%), Immigrants from Morocco (11.3%, a difference of 0.33%), and Immigrants from Syria (11.3%, a difference of 0.34%).
| Demographics | Rating | Rank | Male Poverty |
| Lebanese | 45.6 /100 | #177 | Average 11.2% |
| Immigrants | Cameroon | 44.5 /100 | #178 | Average 11.2% |
| Immigrants | Syria | 40.3 /100 | #179 | Average 11.3% |
| Immigrants | Morocco | 40.1 /100 | #180 | Average 11.3% |
| Immigrants | Costa Rica | 39.5 /100 | #181 | Fair 11.3% |
| Mongolians | 39.0 /100 | #182 | Fair 11.3% |
| Kenyans | 38.4 /100 | #183 | Fair 11.3% |
| Immigrants | South America | 36.9 /100 | #184 | Fair 11.3% |
| Immigrants | Afghanistan | 33.3 /100 | #185 | Fair 11.4% |
| Immigrants | Sierra Leone | 32.9 /100 | #186 | Fair 11.4% |
| Immigrants | Iraq | 31.9 /100 | #187 | Fair 11.4% |
| Sierra Leoneans | 29.9 /100 | #188 | Fair 11.4% |
| Hawaiians | 28.3 /100 | #189 | Fair 11.4% |
| Israelis | 26.1 /100 | #190 | Fair 11.5% |
| South American Indians | 22.8 /100 | #191 | Fair 11.5% |