Immigrants from Dominican Republic vs Immigrants from Ghana Female Poverty Among 18-24 Year Olds
COMPARE
Immigrants from Dominican Republic
Immigrants from Ghana
Female Poverty Among 18-24 Year Olds
Female Poverty Among 18-24 Year Olds Comparison
Immigrants from Dominican Republic
Immigrants from Ghana
21.9%
FEMALE POVERTY AMONG 18-24 YEAR OLDS
0.1/ 100
METRIC RATING
281st/ 347
METRIC RANK
20.5%
FEMALE POVERTY AMONG 18-24 YEAR OLDS
14.3/ 100
METRIC RATING
210th/ 347
METRIC RANK
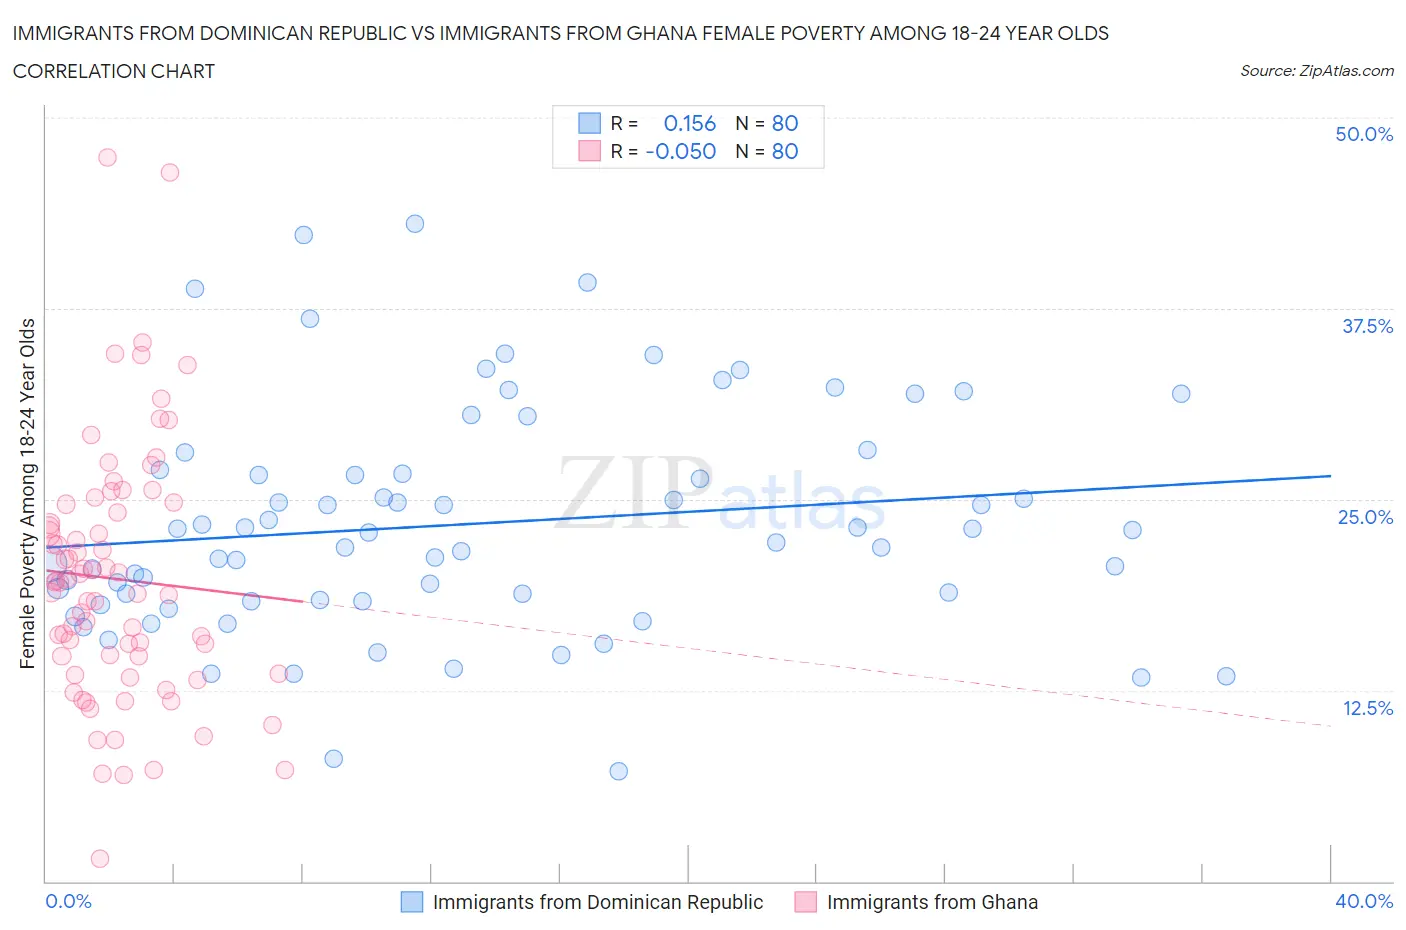
Immigrants from Dominican Republic vs Immigrants from Ghana Female Poverty Among 18-24 Year Olds Correlation Chart
The statistical analysis conducted on geographies consisting of 269,456,906 people shows a poor positive correlation between the proportion of Immigrants from Dominican Republic and poverty level among females between the ages 18 and 24 in the United States with a correlation coefficient (R) of 0.156 and weighted average of 21.9%. Similarly, the statistical analysis conducted on geographies consisting of 197,534,703 people shows a slight negative correlation between the proportion of Immigrants from Ghana and poverty level among females between the ages 18 and 24 in the United States with a correlation coefficient (R) of -0.050 and weighted average of 20.5%, a difference of 6.8%.
Female Poverty Among 18-24 Year Olds Correlation Summary
| Measurement | Immigrants from Dominican Republic | Immigrants from Ghana |
| Minimum | 7.2% | 1.5% |
| Maximum | 43.1% | 47.4% |
| Range | 35.8% | 45.9% |
| Mean | 23.4% | 19.8% |
| Median | 22.5% | 19.6% |
| Interquartile 25% (IQ1) | 18.4% | 14.2% |
| Interquartile 75% (IQ3) | 26.8% | 24.4% |
| Interquartile Range (IQR) | 8.4% | 10.2% |
| Standard Deviation (Sample) | 7.4% | 8.3% |
| Standard Deviation (Population) | 7.4% | 8.3% |
Similar Demographics by Female Poverty Among 18-24 Year Olds
Demographics Similar to Immigrants from Dominican Republic by Female Poverty Among 18-24 Year Olds
In terms of female poverty among 18-24 year olds, the demographic groups most similar to Immigrants from Dominican Republic are Immigrants from Dominica (21.9%, a difference of 0.040%), Spanish American (21.9%, a difference of 0.050%), Bermudan (21.9%, a difference of 0.090%), Yaqui (21.9%, a difference of 0.22%), and Subsaharan African (22.0%, a difference of 0.39%).
| Demographics | Rating | Rank | Female Poverty Among 18-24 Year Olds |
| Immigrants | Honduras | 0.1 /100 | #274 | Tragic 21.8% |
| Immigrants | Bangladesh | 0.1 /100 | #275 | Tragic 21.8% |
| Bahamians | 0.1 /100 | #276 | Tragic 21.8% |
| Immigrants | Switzerland | 0.1 /100 | #277 | Tragic 21.8% |
| Yaqui | 0.1 /100 | #278 | Tragic 21.9% |
| Spanish Americans | 0.1 /100 | #279 | Tragic 21.9% |
| Immigrants | Dominica | 0.1 /100 | #280 | Tragic 21.9% |
| Immigrants | Dominican Republic | 0.1 /100 | #281 | Tragic 21.9% |
| Bermudans | 0.1 /100 | #282 | Tragic 21.9% |
| Sub-Saharan Africans | 0.0 /100 | #283 | Tragic 22.0% |
| Tlingit-Haida | 0.0 /100 | #284 | Tragic 22.0% |
| Ottawa | 0.0 /100 | #285 | Tragic 22.0% |
| Ugandans | 0.0 /100 | #286 | Tragic 22.1% |
| Immigrants | Middle Africa | 0.0 /100 | #287 | Tragic 22.1% |
| Dominicans | 0.0 /100 | #288 | Tragic 22.3% |
Demographics Similar to Immigrants from Ghana by Female Poverty Among 18-24 Year Olds
In terms of female poverty among 18-24 year olds, the demographic groups most similar to Immigrants from Ghana are Immigrants from Western Europe (20.6%, a difference of 0.080%), Arab (20.5%, a difference of 0.11%), Dutch (20.5%, a difference of 0.15%), Spaniard (20.5%, a difference of 0.19%), and Hispanic or Latino (20.5%, a difference of 0.21%).
| Demographics | Rating | Rank | Female Poverty Among 18-24 Year Olds |
| Immigrants | Malaysia | 17.2 /100 | #203 | Poor 20.5% |
| Immigrants | Netherlands | 17.0 /100 | #204 | Poor 20.5% |
| English | 16.7 /100 | #205 | Poor 20.5% |
| Hispanics or Latinos | 16.6 /100 | #206 | Poor 20.5% |
| Spaniards | 16.3 /100 | #207 | Poor 20.5% |
| Dutch | 15.9 /100 | #208 | Poor 20.5% |
| Arabs | 15.5 /100 | #209 | Poor 20.5% |
| Immigrants | Ghana | 14.3 /100 | #210 | Poor 20.5% |
| Immigrants | Western Europe | 13.5 /100 | #211 | Poor 20.6% |
| Liberians | 11.6 /100 | #212 | Poor 20.6% |
| Northern Europeans | 11.6 /100 | #213 | Poor 20.6% |
| Immigrants | South Africa | 10.7 /100 | #214 | Poor 20.6% |
| Spanish | 10.4 /100 | #215 | Poor 20.6% |
| Immigrants | Western Africa | 10.2 /100 | #216 | Poor 20.6% |
| Immigrants | Laos | 9.7 /100 | #217 | Tragic 20.6% |