Immigrants from Dominica vs Spanish Child Poverty Under the Age of 16
COMPARE
Immigrants from Dominica
Spanish
Child Poverty Under the Age of 16
Child Poverty Under the Age of 16 Comparison
Immigrants from Dominica
Spanish
21.9%
CHILD POVERTY UNDER THE AGE OF 16
0.0/ 100
METRIC RATING
317th/ 347
METRIC RANK
16.7%
CHILD POVERTY UNDER THE AGE OF 16
24.5/ 100
METRIC RATING
192nd/ 347
METRIC RANK
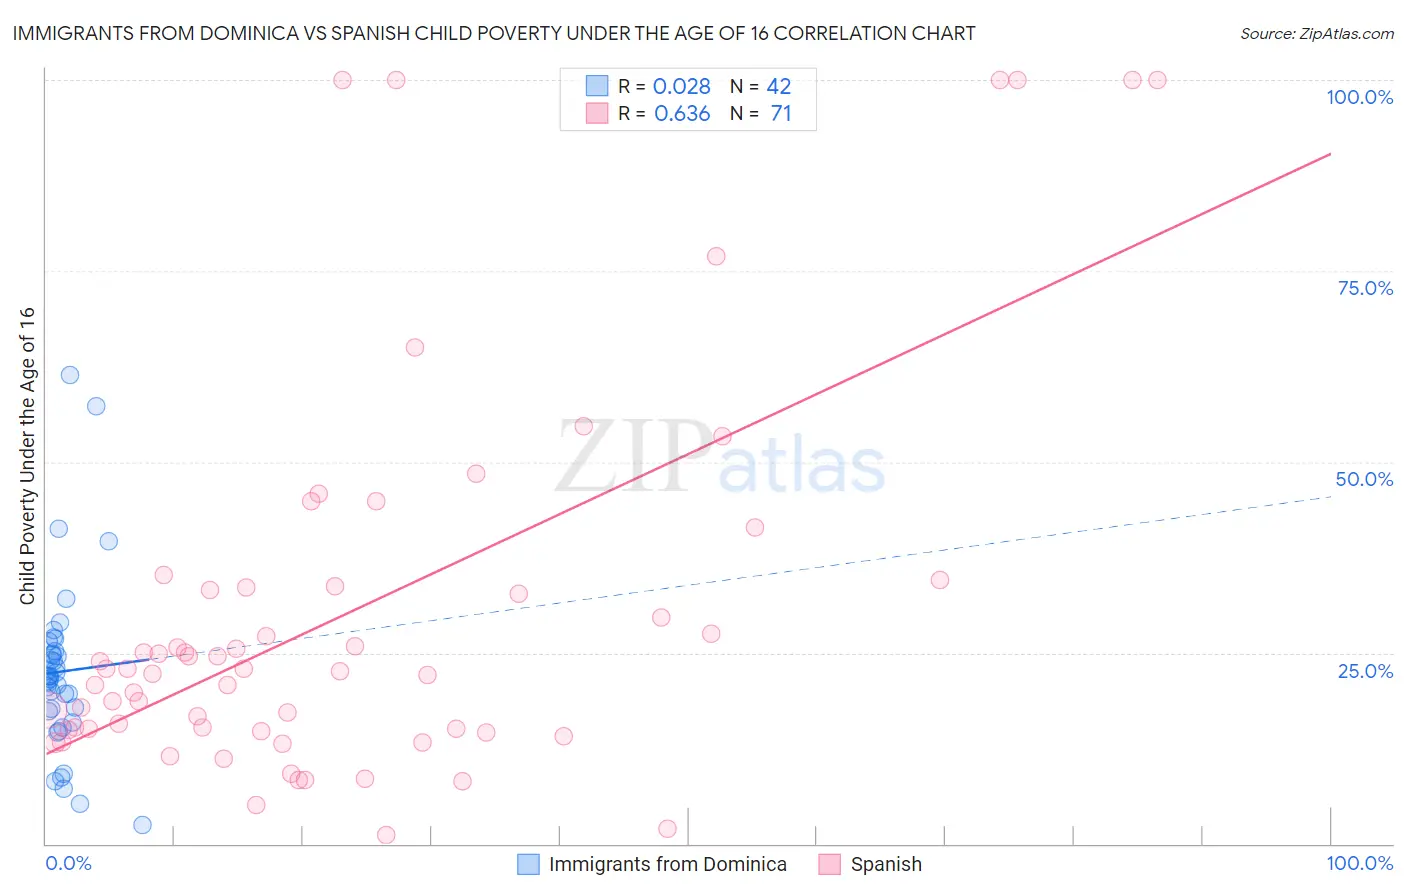
Immigrants from Dominica vs Spanish Child Poverty Under the Age of 16 Correlation Chart
The statistical analysis conducted on geographies consisting of 83,710,455 people shows no correlation between the proportion of Immigrants from Dominica and poverty level among children under the age of 16 in the United States with a correlation coefficient (R) of 0.028 and weighted average of 21.9%. Similarly, the statistical analysis conducted on geographies consisting of 418,352,698 people shows a significant positive correlation between the proportion of Spanish and poverty level among children under the age of 16 in the United States with a correlation coefficient (R) of 0.636 and weighted average of 16.7%, a difference of 30.5%.
Child Poverty Under the Age of 16 Correlation Summary
| Measurement | Immigrants from Dominica | Spanish |
| Minimum | 2.4% | 1.1% |
| Maximum | 61.4% | 100.0% |
| Range | 59.0% | 98.9% |
| Mean | 22.5% | 30.3% |
| Median | 21.7% | 22.9% |
| Interquartile 25% (IQ1) | 17.4% | 14.9% |
| Interquartile 75% (IQ3) | 25.2% | 33.7% |
| Interquartile Range (IQR) | 7.8% | 18.8% |
| Standard Deviation (Sample) | 11.5% | 25.5% |
| Standard Deviation (Population) | 11.4% | 25.3% |
Similar Demographics by Child Poverty Under the Age of 16
Demographics Similar to Immigrants from Dominica by Child Poverty Under the Age of 16
In terms of child poverty under the age of 16, the demographic groups most similar to Immigrants from Dominica are U.S. Virgin Islander (22.0%, a difference of 0.40%), African (21.7%, a difference of 0.77%), Yakama (22.1%, a difference of 0.91%), Cajun (22.1%, a difference of 1.1%), and Immigrants from Guatemala (21.6%, a difference of 1.2%).
| Demographics | Rating | Rank | Child Poverty Under the Age of 16 |
| Bahamians | 0.0 /100 | #310 | Tragic 21.5% |
| Dutch West Indians | 0.0 /100 | #311 | Tragic 21.5% |
| Ute | 0.0 /100 | #312 | Tragic 21.5% |
| Creek | 0.0 /100 | #313 | Tragic 21.5% |
| Immigrants | Somalia | 0.0 /100 | #314 | Tragic 21.6% |
| Immigrants | Guatemala | 0.0 /100 | #315 | Tragic 21.6% |
| Africans | 0.0 /100 | #316 | Tragic 21.7% |
| Immigrants | Dominica | 0.0 /100 | #317 | Tragic 21.9% |
| U.S. Virgin Islanders | 0.0 /100 | #318 | Tragic 22.0% |
| Yakama | 0.0 /100 | #319 | Tragic 22.1% |
| Cajuns | 0.0 /100 | #320 | Tragic 22.1% |
| Kiowa | 0.0 /100 | #321 | Tragic 22.2% |
| Hondurans | 0.0 /100 | #322 | Tragic 22.2% |
| Paiute | 0.0 /100 | #323 | Tragic 22.4% |
| Central American Indians | 0.0 /100 | #324 | Tragic 22.5% |
Demographics Similar to Spanish by Child Poverty Under the Age of 16
In terms of child poverty under the age of 16, the demographic groups most similar to Spanish are Spaniard (16.8%, a difference of 0.20%), Immigrants from Uruguay (16.8%, a difference of 0.22%), Immigrants from Uganda (16.8%, a difference of 0.31%), Immigrants from Lebanon (16.8%, a difference of 0.39%), and Immigrants from Iraq (16.7%, a difference of 0.57%).
| Demographics | Rating | Rank | Child Poverty Under the Age of 16 |
| Immigrants | Bosnia and Herzegovina | 37.4 /100 | #185 | Fair 16.5% |
| Kenyans | 34.1 /100 | #186 | Fair 16.5% |
| Arabs | 31.4 /100 | #187 | Fair 16.6% |
| Immigrants | Morocco | 31.2 /100 | #188 | Fair 16.6% |
| Immigrants | Portugal | 30.0 /100 | #189 | Fair 16.6% |
| Immigrants | Costa Rica | 29.6 /100 | #190 | Fair 16.6% |
| Immigrants | Iraq | 28.3 /100 | #191 | Fair 16.7% |
| Spanish | 24.5 /100 | #192 | Fair 16.7% |
| Spaniards | 23.2 /100 | #193 | Fair 16.8% |
| Immigrants | Uruguay | 23.1 /100 | #194 | Fair 16.8% |
| Immigrants | Uganda | 22.5 /100 | #195 | Fair 16.8% |
| Immigrants | Lebanon | 22.0 /100 | #196 | Fair 16.8% |
| Immigrants | Kenya | 19.1 /100 | #197 | Poor 16.9% |
| Delaware | 17.1 /100 | #198 | Poor 17.0% |
| Immigrants | Afghanistan | 15.1 /100 | #199 | Poor 17.0% |