Immigrants from Dominica vs Puerto Rican Single Father Poverty
COMPARE
Immigrants from Dominica
Puerto Rican
Single Father Poverty
Single Father Poverty Comparison
Immigrants from Dominica
Puerto Ricans
18.9%
SINGLE FATHER POVERTY
0.0/ 100
METRIC RATING
312th/ 347
METRIC RANK
31.5%
SINGLE FATHER POVERTY
0.0/ 100
METRIC RATING
346th/ 347
METRIC RANK
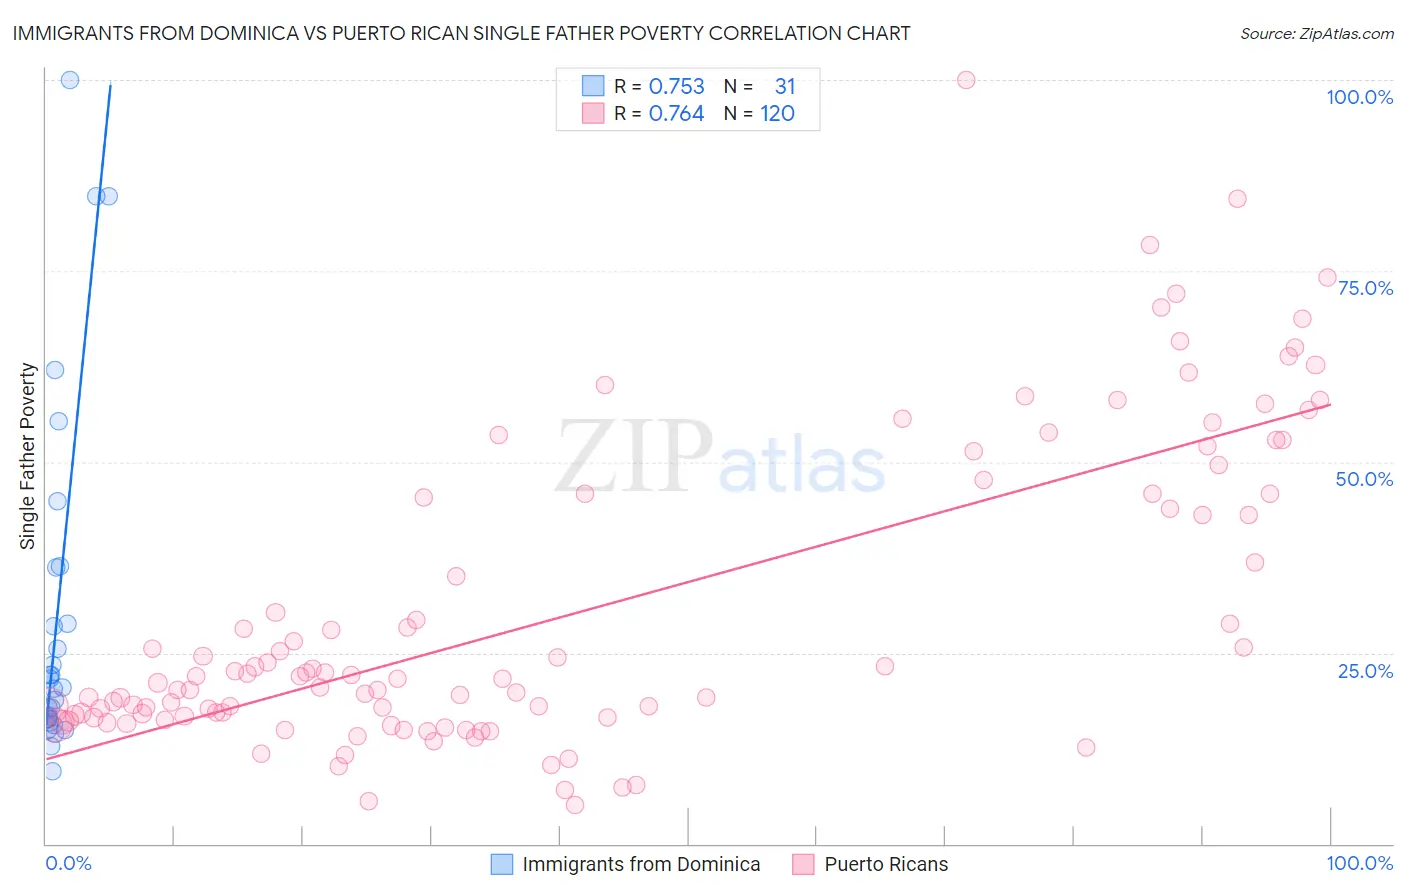
Immigrants from Dominica vs Puerto Rican Single Father Poverty Correlation Chart
The statistical analysis conducted on geographies consisting of 78,251,177 people shows a strong positive correlation between the proportion of Immigrants from Dominica and poverty level among single fathers in the United States with a correlation coefficient (R) of 0.753 and weighted average of 18.9%. Similarly, the statistical analysis conducted on geographies consisting of 394,843,962 people shows a strong positive correlation between the proportion of Puerto Ricans and poverty level among single fathers in the United States with a correlation coefficient (R) of 0.764 and weighted average of 31.5%, a difference of 67.2%.
Single Father Poverty Correlation Summary
| Measurement | Immigrants from Dominica | Puerto Rican |
| Minimum | 9.4% | 5.1% |
| Maximum | 100.0% | 100.0% |
| Range | 90.6% | 94.9% |
| Mean | 30.2% | 30.4% |
| Median | 20.5% | 21.8% |
| Interquartile 25% (IQ1) | 16.4% | 16.6% |
| Interquartile 75% (IQ3) | 36.1% | 45.8% |
| Interquartile Range (IQR) | 19.7% | 29.2% |
| Standard Deviation (Sample) | 23.3% | 20.1% |
| Standard Deviation (Population) | 22.9% | 20.0% |
Similar Demographics by Single Father Poverty
Demographics Similar to Immigrants from Dominica by Single Father Poverty
In terms of single father poverty, the demographic groups most similar to Immigrants from Dominica are Nonimmigrants (18.8%, a difference of 0.050%), Potawatomi (18.9%, a difference of 0.20%), Chippewa (18.8%, a difference of 0.24%), Delaware (18.9%, a difference of 0.36%), and Chickasaw (19.0%, a difference of 0.52%).
| Demographics | Rating | Rank | Single Father Poverty |
| Blackfeet | 0.0 /100 | #305 | Tragic 18.5% |
| Scotch-Irish | 0.0 /100 | #306 | Tragic 18.6% |
| French Canadians | 0.0 /100 | #307 | Tragic 18.6% |
| Ottawa | 0.0 /100 | #308 | Tragic 18.6% |
| Immigrants | Micronesia | 0.0 /100 | #309 | Tragic 18.6% |
| Chippewa | 0.0 /100 | #310 | Tragic 18.8% |
| Immigrants | Nonimmigrants | 0.0 /100 | #311 | Tragic 18.8% |
| Immigrants | Dominica | 0.0 /100 | #312 | Tragic 18.9% |
| Potawatomi | 0.0 /100 | #313 | Tragic 18.9% |
| Delaware | 0.0 /100 | #314 | Tragic 18.9% |
| Chickasaw | 0.0 /100 | #315 | Tragic 19.0% |
| Osage | 0.0 /100 | #316 | Tragic 19.0% |
| Dominicans | 0.0 /100 | #317 | Tragic 19.1% |
| Dutch West Indians | 0.0 /100 | #318 | Tragic 19.2% |
| Slovaks | 0.0 /100 | #319 | Tragic 19.3% |
Demographics Similar to Puerto Ricans by Single Father Poverty
In terms of single father poverty, the demographic groups most similar to Puerto Ricans are Yup'ik (32.5%, a difference of 3.2%), Crow (30.3%, a difference of 4.1%), Navajo (29.2%, a difference of 7.9%), Lumbee (28.5%, a difference of 10.7%), and Yuman (28.4%, a difference of 11.0%).
| Demographics | Rating | Rank | Single Father Poverty |
| Natives/Alaskans | 0.0 /100 | #333 | Tragic 22.4% |
| Kiowa | 0.0 /100 | #334 | Tragic 22.5% |
| Shoshone | 0.0 /100 | #335 | Tragic 22.9% |
| Cajuns | 0.0 /100 | #336 | Tragic 23.1% |
| Sioux | 0.0 /100 | #337 | Tragic 23.9% |
| Arapaho | 0.0 /100 | #338 | Tragic 24.0% |
| Apache | 0.0 /100 | #339 | Tragic 24.2% |
| Houma | 0.0 /100 | #340 | Tragic 26.7% |
| Hopi | 0.0 /100 | #341 | Tragic 27.2% |
| Yuman | 0.0 /100 | #342 | Tragic 28.4% |
| Lumbee | 0.0 /100 | #343 | Tragic 28.5% |
| Navajo | 0.0 /100 | #344 | Tragic 29.2% |
| Crow | 0.0 /100 | #345 | Tragic 30.3% |
| Puerto Ricans | 0.0 /100 | #346 | Tragic 31.5% |
| Yup'ik | 0.0 /100 | #347 | Tragic 32.5% |