Immigrants from Dominica vs Immigrants from Mexico Single Mother Poverty
COMPARE
Immigrants from Dominica
Immigrants from Mexico
Single Mother Poverty
Single Mother Poverty Comparison
Immigrants from Dominica
Immigrants from Mexico
32.5%
SINGLE MOTHER POVERTY
0.0/ 100
METRIC RATING
287th/ 347
METRIC RANK
34.0%
SINGLE MOTHER POVERTY
0.0/ 100
METRIC RATING
308th/ 347
METRIC RANK
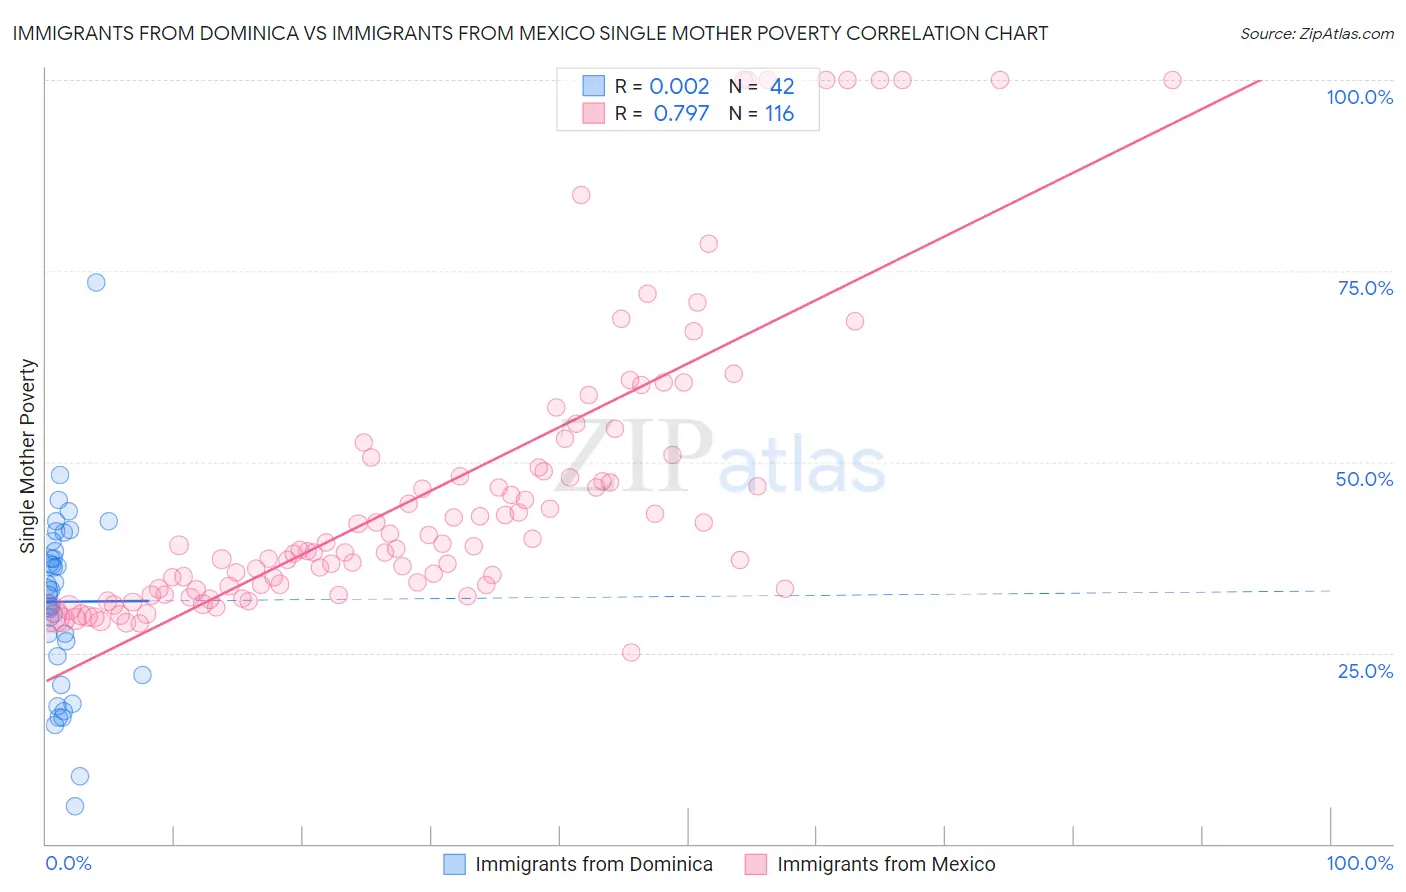
Immigrants from Dominica vs Immigrants from Mexico Single Mother Poverty Correlation Chart
The statistical analysis conducted on geographies consisting of 83,555,072 people shows no correlation between the proportion of Immigrants from Dominica and poverty level among single mothers in the United States with a correlation coefficient (R) of 0.002 and weighted average of 32.5%. Similarly, the statistical analysis conducted on geographies consisting of 497,741,826 people shows a strong positive correlation between the proportion of Immigrants from Mexico and poverty level among single mothers in the United States with a correlation coefficient (R) of 0.797 and weighted average of 34.0%, a difference of 4.6%.
Single Mother Poverty Correlation Summary
| Measurement | Immigrants from Dominica | Immigrants from Mexico |
| Minimum | 4.9% | 25.0% |
| Maximum | 73.5% | 100.0% |
| Range | 68.7% | 75.0% |
| Mean | 31.7% | 46.2% |
| Median | 32.8% | 38.8% |
| Interquartile 25% (IQ1) | 24.6% | 33.4% |
| Interquartile 75% (IQ3) | 38.3% | 49.9% |
| Interquartile Range (IQR) | 13.7% | 16.5% |
| Standard Deviation (Sample) | 12.0% | 19.4% |
| Standard Deviation (Population) | 11.9% | 19.3% |
Similar Demographics by Single Mother Poverty
Demographics Similar to Immigrants from Dominica by Single Mother Poverty
In terms of single mother poverty, the demographic groups most similar to Immigrants from Dominica are Yup'ik (32.5%, a difference of 0.13%), Immigrants from Latin America (32.4%, a difference of 0.20%), Somali (32.6%, a difference of 0.23%), U.S. Virgin Islander (32.6%, a difference of 0.25%), and Indonesian (32.4%, a difference of 0.31%).
| Demographics | Rating | Rank | Single Mother Poverty |
| Immigrants | Nonimmigrants | 0.0 /100 | #280 | Tragic 32.2% |
| Cree | 0.0 /100 | #281 | Tragic 32.2% |
| Immigrants | Azores | 0.0 /100 | #282 | Tragic 32.2% |
| Spanish Americans | 0.0 /100 | #283 | Tragic 32.3% |
| Indonesians | 0.0 /100 | #284 | Tragic 32.4% |
| Immigrants | Latin America | 0.0 /100 | #285 | Tragic 32.4% |
| Yup'ik | 0.0 /100 | #286 | Tragic 32.5% |
| Immigrants | Dominica | 0.0 /100 | #287 | Tragic 32.5% |
| Somalis | 0.0 /100 | #288 | Tragic 32.6% |
| U.S. Virgin Islanders | 0.0 /100 | #289 | Tragic 32.6% |
| Osage | 0.0 /100 | #290 | Tragic 32.6% |
| Guatemalans | 0.0 /100 | #291 | Tragic 32.9% |
| Shoshone | 0.0 /100 | #292 | Tragic 32.9% |
| Aleuts | 0.0 /100 | #293 | Tragic 32.9% |
| French American Indians | 0.0 /100 | #294 | Tragic 33.1% |
Demographics Similar to Immigrants from Mexico by Single Mother Poverty
In terms of single mother poverty, the demographic groups most similar to Immigrants from Mexico are Comanche (33.9%, a difference of 0.18%), Potawatomi (34.1%, a difference of 0.42%), Immigrants from Congo (33.8%, a difference of 0.60%), Honduran (34.2%, a difference of 0.64%), and Alsatian (34.3%, a difference of 0.95%).
| Demographics | Rating | Rank | Single Mother Poverty |
| Immigrants | Somalia | 0.0 /100 | #301 | Tragic 33.4% |
| Arapaho | 0.0 /100 | #302 | Tragic 33.4% |
| Americans | 0.0 /100 | #303 | Tragic 33.5% |
| Mexicans | 0.0 /100 | #304 | Tragic 33.6% |
| Immigrants | Central America | 0.0 /100 | #305 | Tragic 33.6% |
| Immigrants | Congo | 0.0 /100 | #306 | Tragic 33.8% |
| Comanche | 0.0 /100 | #307 | Tragic 33.9% |
| Immigrants | Mexico | 0.0 /100 | #308 | Tragic 34.0% |
| Potawatomi | 0.0 /100 | #309 | Tragic 34.1% |
| Hondurans | 0.0 /100 | #310 | Tragic 34.2% |
| Alsatians | 0.0 /100 | #311 | Tragic 34.3% |
| Central American Indians | 0.0 /100 | #312 | Tragic 34.3% |
| Immigrants | Dominican Republic | 0.0 /100 | #313 | Tragic 34.4% |
| Chickasaw | 0.0 /100 | #314 | Tragic 34.4% |
| Hopi | 0.0 /100 | #315 | Tragic 34.5% |