Immigrants from Dominica vs Immigrants from Dominican Republic Poverty
COMPARE
Immigrants from Dominica
Immigrants from Dominican Republic
Poverty
Poverty Comparison
Immigrants from Dominica
Immigrants from Dominican Republic
16.1%
POVERTY
0.0/ 100
METRIC RATING
318th/ 347
METRIC RANK
17.8%
POVERTY
0.0/ 100
METRIC RATING
331st/ 347
METRIC RANK
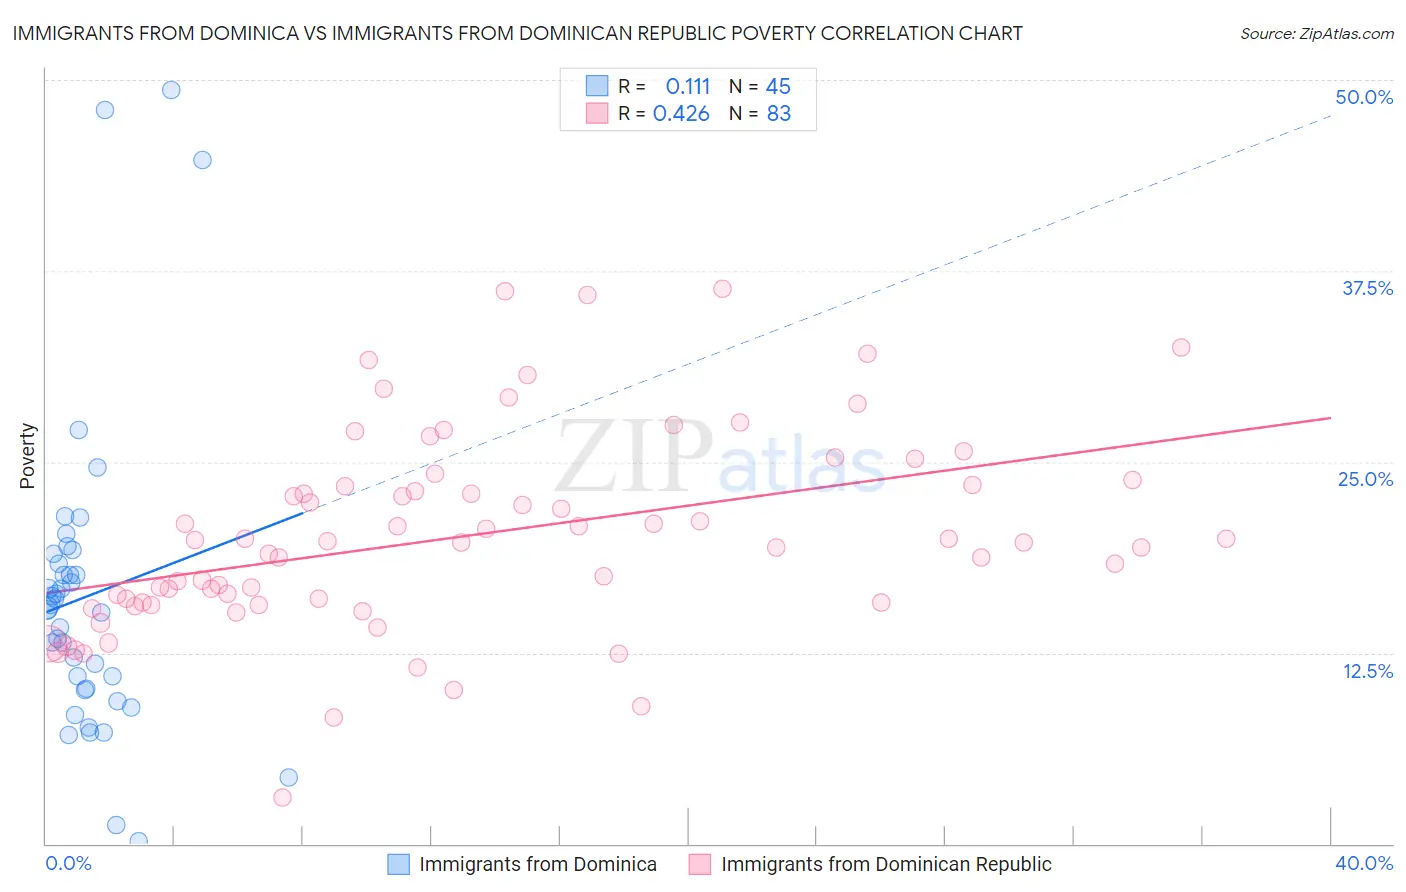
Immigrants from Dominica vs Immigrants from Dominican Republic Poverty Correlation Chart
The statistical analysis conducted on geographies consisting of 83,789,226 people shows a poor positive correlation between the proportion of Immigrants from Dominica and poverty level in the United States with a correlation coefficient (R) of 0.111 and weighted average of 16.1%. Similarly, the statistical analysis conducted on geographies consisting of 274,963,849 people shows a moderate positive correlation between the proportion of Immigrants from Dominican Republic and poverty level in the United States with a correlation coefficient (R) of 0.426 and weighted average of 17.8%, a difference of 10.6%.
Poverty Correlation Summary
| Measurement | Immigrants from Dominica | Immigrants from Dominican Republic |
| Minimum | 0.13% | 3.0% |
| Maximum | 49.3% | 36.4% |
| Range | 49.2% | 33.4% |
| Mean | 16.2% | 20.2% |
| Median | 15.5% | 19.8% |
| Interquartile 25% (IQ1) | 10.1% | 15.8% |
| Interquartile 75% (IQ3) | 18.7% | 23.5% |
| Interquartile Range (IQR) | 8.6% | 7.7% |
| Standard Deviation (Sample) | 10.1% | 6.5% |
| Standard Deviation (Population) | 10.0% | 6.5% |
Demographics Similar to Immigrants from Dominica and Immigrants from Dominican Republic by Poverty
In terms of poverty, the demographic groups most similar to Immigrants from Dominica are Immigrants from Congo (16.1%, a difference of 0.20%), U.S. Virgin Islander (16.1%, a difference of 0.29%), Immigrants from Honduras (16.2%, a difference of 0.43%), Arapaho (16.3%, a difference of 1.2%), and British West Indian (15.9%, a difference of 1.5%). Similarly, the demographic groups most similar to Immigrants from Dominican Republic are Dominican (17.6%, a difference of 0.92%), Native/Alaskan (18.1%, a difference of 1.4%), Black/African American (17.3%, a difference of 3.2%), Houma (18.4%, a difference of 3.5%), and Apache (18.4%, a difference of 3.5%).
| Demographics | Rating | Rank | Poverty |
| Immigrants | Somalia | 0.0 /100 | #314 | Tragic 15.8% |
| British West Indians | 0.0 /100 | #315 | Tragic 15.9% |
| Hondurans | 0.0 /100 | #316 | Tragic 15.9% |
| U.S. Virgin Islanders | 0.0 /100 | #317 | Tragic 16.1% |
| Immigrants | Dominica | 0.0 /100 | #318 | Tragic 16.1% |
| Immigrants | Congo | 0.0 /100 | #319 | Tragic 16.1% |
| Immigrants | Honduras | 0.0 /100 | #320 | Tragic 16.2% |
| Arapaho | 0.0 /100 | #321 | Tragic 16.3% |
| Menominee | 0.0 /100 | #322 | Tragic 16.4% |
| Colville | 0.0 /100 | #323 | Tragic 16.6% |
| Yakama | 0.0 /100 | #324 | Tragic 16.7% |
| Central American Indians | 0.0 /100 | #325 | Tragic 16.7% |
| Paiute | 0.0 /100 | #326 | Tragic 16.7% |
| Kiowa | 0.0 /100 | #327 | Tragic 16.8% |
| Ute | 0.0 /100 | #328 | Tragic 16.9% |
| Blacks/African Americans | 0.0 /100 | #329 | Tragic 17.3% |
| Dominicans | 0.0 /100 | #330 | Tragic 17.6% |
| Immigrants | Dominican Republic | 0.0 /100 | #331 | Tragic 17.8% |
| Natives/Alaskans | 0.0 /100 | #332 | Tragic 18.1% |
| Houma | 0.0 /100 | #333 | Tragic 18.4% |
| Apache | 0.0 /100 | #334 | Tragic 18.4% |