Immigrants from Czechoslovakia vs Immigrants from Northern Europe Family Poverty

COMPARE

Immigrants from Czechoslovakia
Race
Ancestry
AfghanAfricanAlaska NativeAlaskan AthabascanAlbanianAleutAlsatianAmericanApacheArabArapahoArgentineanArmenianAssyrian/Chaldean/SyriacAustralianAustrianBahamianBangladeshiBarbadianBasqueBelgianBelizeanBermudanBhutaneseBlackfeetBolivianBrazilianBritishBritish West IndianBulgarianBurmeseCajunCambodianCanadianCape VerdeanCarpatho RusynCelticCentral AmericanCentral American IndianCherokeeCheyenneChickasawChileanChineseChippewaChoctawColombianColvilleComancheCosta RicanCreeCreekCroatianCrowCubanCypriotCzechCzechoslovakianDanishDelawareDominicanDutchDutch West IndianEastern EuropeanEcuadorianEgyptianEnglishEstonianEthiopianEuropeanFijianFilipinoFinnishFrenchFrench American IndianFrench CanadianGermanGerman RussianGhanaianGreekGuamanian/ChamorroGuatemalanGuyaneseHaitianHmongHonduranHopiHoumaHungarianIcelanderIndian (Asian)IndonesianInupiatIranianIraqiIrishIroquoisIsraeliItalianJamaicanJapaneseJordanianKenyanKiowaKoreanLaotianLatvianLebaneseLiberianLithuanianLumbeeLuxembourgerMacedonianMalaysianMalteseMarshalleseMenomineeMexicanMexican American IndianMongolianMoroccanNative HawaiianNavajoNepaleseNew ZealanderNicaraguanNigerianNorthern EuropeanNorwegianOkinawanOsageOttawaPaiutePakistaniPalestinianPanamanianParaguayanPennsylvania GermanPeruvianPimaPolishPortuguesePotawatomiPuebloPuerto RicanPuget Sound SalishRomanianRussianSalvadoranSamoanScandinavianScotch-IrishScottishSeminoleSenegaleseSerbianShoshoneSierra LeoneanSiouxSlavicSlovakSloveneSomaliSouth AfricanSouth AmericanSouth American IndianSoviet UnionSpaniardSpanishSpanish AmericanSpanish American IndianSri LankanSubsaharan AfricanSudaneseSwedishSwissSyrianTaiwaneseThaiTlingit-HaidaTohono O'OdhamTonganTrinidadian and TobagonianTsimshianTurkishU.S. Virgin IslanderUgandanUkrainianUruguayanUteVenezuelanVietnameseWelshWest IndianYakamaYaquiYugoslavianYumanYup'ikZimbabwean
Immigration
NonimmigrantsImmigrantsAfghanistanAfricaAlbaniaArgentinaArmeniaAsiaAustraliaAustriaBahamasBangladeshBarbadosBelarusBelgiumBelizeBoliviaBosnia and HerzegovinaBrazilBulgariaBurma/MyanmarCabo VerdeCambodiaCameroonCanadaCaribbeanCentral AmericaChileChinaColombiaCongoCosta RicaCroatiaCubaCzechoslovakiaDenmarkDominicaDominican RepublicEastern AfricaEastern AsiaEastern EuropeEcuadorEgyptEl SalvadorEnglandEritreaEthiopiaEuropeFijiFranceGermanyGhanaGreeceGrenadaGuatemalaGuyanaHaitiHondurasHong KongHungaryIndiaIndonesiaIranIraqIrelandIsraelItalyJamaicaJapanJordanKazakhstanKenyaKoreaKuwaitLaosLatin AmericaLatviaLebanonLiberiaLithuaniaMalaysiaMexicoMicronesiaMiddle AfricaMoldovaMoroccoNepalNetherlandsNicaraguaNigeriaNorth AmericaNorth MacedoniaNorthern AfricaNorwayOceaniaPakistanPanamaPeruPhilippinesPolandPortugalRomaniaRussiaSaudi ArabiaScotlandSenegalSerbiaSierra LeoneSingaporeSomaliaSouth AfricaSouth AmericaSouth Central AsiaSouth Eastern AsiaSouthern EuropeSpainSri LankaSt. Vincent and the GrenadinesSudanSwedenSwitzerlandSyriaTaiwanThailandTrinidad and TobagoTurkeyUgandaUkraineUruguayUzbekistanVenezuelaVietnamWest IndiesWestern AfricaWestern AsiaWestern EuropeYemenZaireZimbabweAzores
Immigrants from Northern Europe
Race
Ancestry
AfghanAfricanAlaska NativeAlaskan AthabascanAlbanianAleutAlsatianAmericanApacheArabArapahoArgentineanArmenianAssyrian/Chaldean/SyriacAustralianAustrianBahamianBangladeshiBarbadianBasqueBelgianBelizeanBermudanBhutaneseBlackfeetBolivianBrazilianBritishBritish West IndianBulgarianBurmeseCajunCambodianCanadianCape VerdeanCarpatho RusynCelticCentral AmericanCentral American IndianCherokeeCheyenneChickasawChileanChineseChippewaChoctawColombianColvilleComancheCosta RicanCreeCreekCroatianCrowCubanCypriotCzechCzechoslovakianDanishDelawareDominicanDutchDutch West IndianEastern EuropeanEcuadorianEgyptianEnglishEstonianEthiopianEuropeanFijianFilipinoFinnishFrenchFrench American IndianFrench CanadianGermanGerman RussianGhanaianGreekGuamanian/ChamorroGuatemalanGuyaneseHaitianHmongHonduranHopiHoumaHungarianIcelanderIndian (Asian)IndonesianInupiatIranianIraqiIrishIroquoisIsraeliItalianJamaicanJapaneseJordanianKenyanKiowaKoreanLaotianLatvianLebaneseLiberianLithuanianLumbeeLuxembourgerMacedonianMalaysianMalteseMarshalleseMenomineeMexicanMexican American IndianMongolianMoroccanNative HawaiianNavajoNepaleseNew ZealanderNicaraguanNigerianNorthern EuropeanNorwegianOkinawanOsageOttawaPaiutePakistaniPalestinianPanamanianParaguayanPennsylvania GermanPeruvianPimaPolishPortuguesePotawatomiPuebloPuerto RicanPuget Sound SalishRomanianRussianSalvadoranSamoanScandinavianScotch-IrishScottishSeminoleSenegaleseSerbianShoshoneSierra LeoneanSiouxSlavicSlovakSloveneSomaliSouth AfricanSouth AmericanSouth American IndianSoviet UnionSpaniardSpanishSpanish AmericanSpanish American IndianSri LankanSubsaharan AfricanSudaneseSwedishSwissSyrianTaiwaneseThaiTlingit-HaidaTohono O'OdhamTonganTrinidadian and TobagonianTsimshianTurkishU.S. Virgin IslanderUgandanUkrainianUruguayanUteVenezuelanVietnameseWelshWest IndianYakamaYaquiYugoslavianYumanYup'ikZimbabwean
Immigration
NonimmigrantsImmigrantsAfghanistanAfricaAlbaniaArgentinaArmeniaAsiaAustraliaAustriaBahamasBangladeshBarbadosBelarusBelgiumBelizeBoliviaBosnia and HerzegovinaBrazilBulgariaBurma/MyanmarCabo VerdeCambodiaCameroonCanadaCaribbeanCentral AmericaChileChinaColombiaCongoCosta RicaCroatiaCubaDenmarkDominicaDominican RepublicEastern AfricaEastern AsiaEastern EuropeEcuadorEgyptEl SalvadorEnglandEritreaEthiopiaEuropeFijiFranceGermanyGhanaGreeceGrenadaGuatemalaGuyanaHaitiHondurasHong KongHungaryIndiaIndonesiaIranIraqIrelandIsraelItalyJamaicaJapanJordanKazakhstanKenyaKoreaKuwaitLaosLatin AmericaLatviaLebanonLiberiaLithuaniaMalaysiaMexicoMicronesiaMiddle AfricaMoldovaMoroccoNepalNetherlandsNicaraguaNigeriaNorth AmericaNorth MacedoniaNorthern AfricaNorthern EuropeNorwayOceaniaPakistanPanamaPeruPhilippinesPolandPortugalRomaniaRussiaSaudi ArabiaScotlandSenegalSerbiaSierra LeoneSingaporeSomaliaSouth AfricaSouth AmericaSouth Central AsiaSouth Eastern AsiaSouthern EuropeSpainSri LankaSt. Vincent and the GrenadinesSudanSwedenSwitzerlandSyriaTaiwanThailandTrinidad and TobagoTurkeyUgandaUkraineUruguayUzbekistanVenezuelaVietnamWest IndiesWestern AfricaWestern AsiaWestern EuropeYemenZaireZimbabweAzores
Family Poverty
Income
Poverty
Unemployment
Labor Participation
Family Structure
Vehicle Availability
Education Level
Disability

Family Poverty Comparison

Immigrants from Czechoslovakia

Immigrants from Northern Europe

Exceptional
Exceptional
7.7%
FAMILY POVERTY
98.9/ 100
METRIC RATING
47th/ 347
METRIC RANK
7.4%
FAMILY POVERTY
99.6/ 100
METRIC RATING
29th/ 347
METRIC RANK

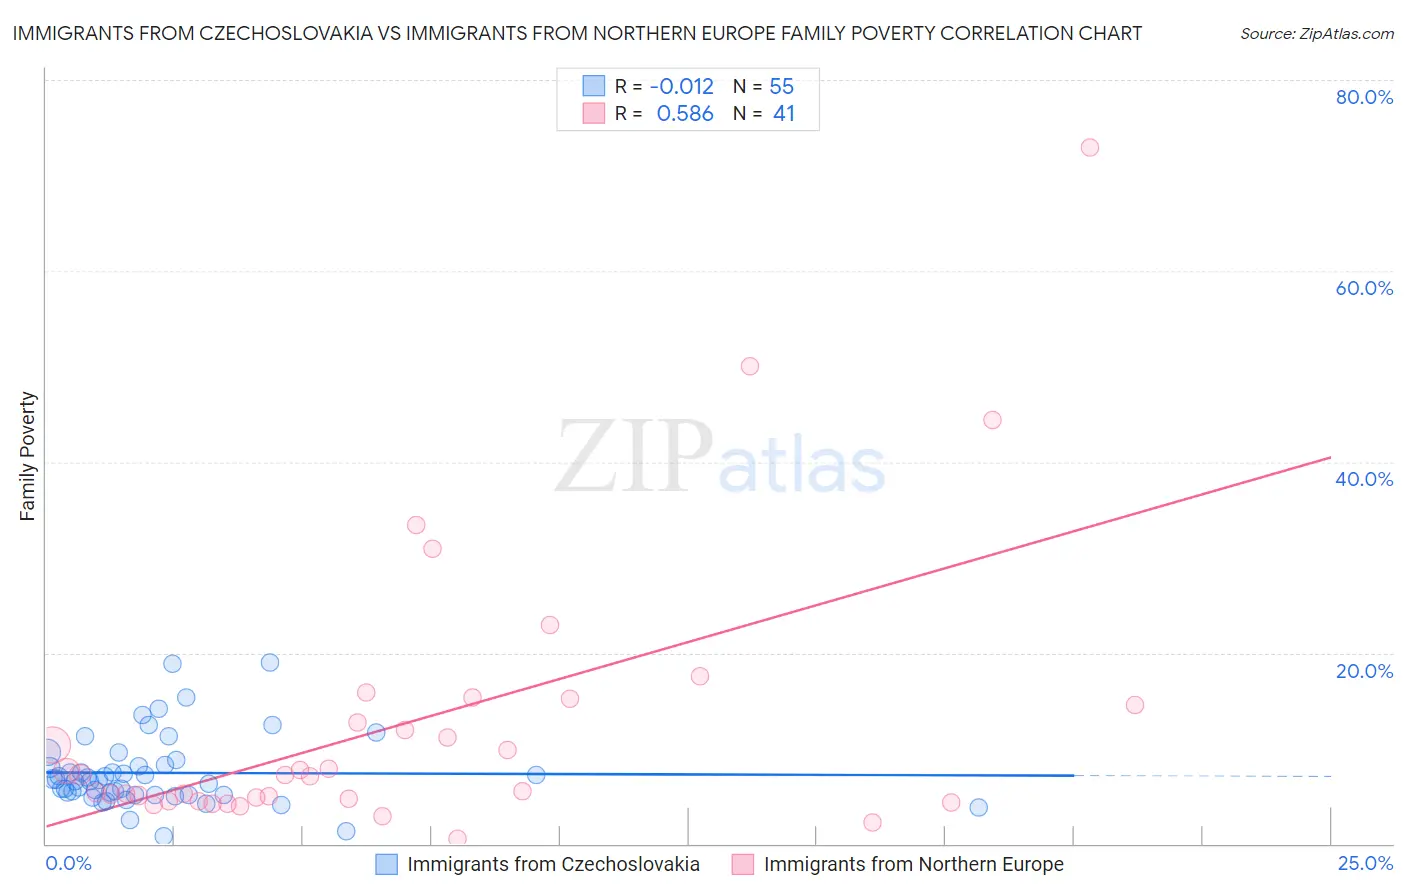
Immigrants from Czechoslovakia vs Immigrants from Northern Europe Family Poverty Correlation Chart

The statistical analysis conducted on geographies consisting of 195,180,585 people shows no correlation between the proportion of Immigrants from Czechoslovakia and poverty level among families in the United States with a correlation coefficient (R) of -0.012 and weighted average of 7.7%. Similarly, the statistical analysis conducted on geographies consisting of 475,098,586 people shows a substantial positive correlation between the proportion of Immigrants from Northern Europe and poverty level among families in the United States with a correlation coefficient (R) of 0.586 and weighted average of 7.4%, a difference of 3.9%.
Immigrants from Czechoslovakia vs Immigrants from Northern Europe Family Poverty

Family Poverty Correlation Summary

MeasurementImmigrants from CzechoslovakiaImmigrants from Northern Europe
Minimum0.73%0.50%
Maximum19.0%72.9%
Range18.3%72.4%
Mean7.4%12.6%
Median6.7%7.3%
Interquartile 25% (IQ1)5.2%4.6%
Interquartile 75% (IQ3)8.3%14.9%
Interquartile Range (IQR)3.1%10.3%
Standard Deviation (Sample)3.7%14.6%
Standard Deviation (Population)3.7%14.4%

Demographics Similar to Immigrants from Czechoslovakia and Immigrants from Northern Europe by Family Poverty

In terms of family poverty, the demographic groups most similar to Immigrants from Czechoslovakia are Tongan (7.7%, a difference of 0.010%), Immigrants from Sri Lanka (7.7%, a difference of 0.020%), Okinawan (7.7%, a difference of 0.030%), German (7.7%, a difference of 0.15%), and Immigrants from Austria (7.6%, a difference of 0.44%). Similarly, the demographic groups most similar to Immigrants from Northern Europe are Immigrants from Korea (7.4%, a difference of 0.17%), Italian (7.4%, a difference of 0.29%), Czech (7.4%, a difference of 0.41%), Polish (7.4%, a difference of 0.71%), and Immigrants from Japan (7.4%, a difference of 0.71%).
DemographicsRating | RankFamily Poverty
Immigrants | Korea
99.6
/100
|
#28
Exceptional
7.4%
Immigrants | Northern Europe
99.6
/100
|
#29
Exceptional
7.4%
Italians
99.6
/100
|
#30
Exceptional
7.4%
Czechs
99.6
/100
|
#31
Exceptional
7.4%
Poles
99.5
/100
|
#32
Exceptional
7.4%
Immigrants | Japan
99.5
/100
|
#33
Exceptional
7.4%
Russians
99.5
/100
|
#34
Exceptional
7.5%
Greeks
99.4
/100
|
#35
Exceptional
7.5%
Turks
99.4
/100
|
#36
Exceptional
7.5%
Estonians
99.4
/100
|
#37
Exceptional
7.5%
Bolivians
99.3
/100
|
#38
Exceptional
7.5%
Carpatho Rusyns
99.3
/100
|
#39
Exceptional
7.5%
Slovenes
99.3
/100
|
#40
Exceptional
7.5%
Immigrants | Australia
99.2
/100
|
#41
Exceptional
7.6%
Scandinavians
99.1
/100
|
#42
Exceptional
7.6%
Immigrants | Austria
99.1
/100
|
#43
Exceptional
7.6%
Germans
99.0
/100
|
#44
Exceptional
7.7%
Okinawans
98.9
/100
|
#45
Exceptional
7.7%
Tongans
98.9
/100
|
#46
Exceptional
7.7%
Immigrants | Czechoslovakia
98.9
/100
|
#47
Exceptional
7.7%
Immigrants | Sri Lanka
98.9
/100
|
#48
Exceptional
7.7%