Immigrants from Czechoslovakia vs Immigrants from Ecuador Child Poverty Under the Age of 5

COMPARE

Immigrants from Czechoslovakia
Race
Ancestry
AfghanAfricanAlaska NativeAlaskan AthabascanAlbanianAleutAlsatianAmericanApacheArabArapahoArgentineanArmenianAssyrian/Chaldean/SyriacAustralianAustrianBahamianBangladeshiBarbadianBasqueBelgianBelizeanBermudanBhutaneseBlackfeetBolivianBrazilianBritishBritish West IndianBulgarianBurmeseCajunCambodianCanadianCape VerdeanCarpatho RusynCelticCentral AmericanCentral American IndianCherokeeCheyenneChickasawChileanChineseChippewaChoctawColombianColvilleComancheCosta RicanCreeCreekCroatianCrowCubanCypriotCzechCzechoslovakianDanishDelawareDominicanDutchDutch West IndianEastern EuropeanEcuadorianEgyptianEnglishEstonianEthiopianEuropeanFijianFilipinoFinnishFrenchFrench American IndianFrench CanadianGermanGerman RussianGhanaianGreekGuamanian/ChamorroGuatemalanGuyaneseHaitianHmongHonduranHopiHoumaHungarianIcelanderIndian (Asian)IndonesianInupiatIranianIraqiIrishIroquoisIsraeliItalianJamaicanJapaneseJordanianKenyanKiowaKoreanLaotianLatvianLebaneseLiberianLithuanianLumbeeLuxembourgerMacedonianMalaysianMalteseMarshalleseMenomineeMexicanMexican American IndianMongolianMoroccanNative HawaiianNavajoNepaleseNew ZealanderNicaraguanNigerianNorthern EuropeanNorwegianOkinawanOsageOttawaPaiutePakistaniPalestinianPanamanianParaguayanPennsylvania GermanPeruvianPimaPolishPortuguesePotawatomiPuebloPuerto RicanPuget Sound SalishRomanianRussianSalvadoranSamoanScandinavianScotch-IrishScottishSeminoleSenegaleseSerbianShoshoneSierra LeoneanSiouxSlavicSlovakSloveneSomaliSouth AfricanSouth AmericanSouth American IndianSoviet UnionSpaniardSpanishSpanish AmericanSpanish American IndianSri LankanSubsaharan AfricanSudaneseSwedishSwissSyrianTaiwaneseThaiTlingit-HaidaTohono O'OdhamTonganTrinidadian and TobagonianTsimshianTurkishU.S. Virgin IslanderUgandanUkrainianUruguayanUteVenezuelanVietnameseWelshWest IndianYakamaYaquiYugoslavianYumanYup'ikZimbabwean
Immigration
NonimmigrantsImmigrantsAfghanistanAfricaAlbaniaArgentinaArmeniaAsiaAustraliaAustriaBahamasBangladeshBarbadosBelarusBelgiumBelizeBoliviaBosnia and HerzegovinaBrazilBulgariaBurma/MyanmarCabo VerdeCambodiaCameroonCanadaCaribbeanCentral AmericaChileChinaColombiaCongoCosta RicaCroatiaCubaCzechoslovakiaDenmarkDominicaDominican RepublicEastern AfricaEastern AsiaEastern EuropeEgyptEl SalvadorEnglandEritreaEthiopiaEuropeFijiFranceGermanyGhanaGreeceGrenadaGuatemalaGuyanaHaitiHondurasHong KongHungaryIndiaIndonesiaIranIraqIrelandIsraelItalyJamaicaJapanJordanKazakhstanKenyaKoreaKuwaitLaosLatin AmericaLatviaLebanonLiberiaLithuaniaMalaysiaMexicoMicronesiaMiddle AfricaMoldovaMoroccoNepalNetherlandsNicaraguaNigeriaNorth AmericaNorth MacedoniaNorthern AfricaNorthern EuropeNorwayOceaniaPakistanPanamaPeruPhilippinesPolandPortugalRomaniaRussiaSaudi ArabiaScotlandSenegalSerbiaSierra LeoneSingaporeSomaliaSouth AfricaSouth AmericaSouth Central AsiaSouth Eastern AsiaSouthern EuropeSpainSri LankaSt. Vincent and the GrenadinesSudanSwedenSwitzerlandSyriaTaiwanThailandTrinidad and TobagoTurkeyUgandaUkraineUruguayUzbekistanVenezuelaVietnamWest IndiesWestern AfricaWestern AsiaWestern EuropeYemenZaireZimbabweAzores
Immigrants from Ecuador
Race
Ancestry
AfghanAfricanAlaska NativeAlaskan AthabascanAlbanianAleutAlsatianAmericanApacheArabArapahoArgentineanArmenianAssyrian/Chaldean/SyriacAustralianAustrianBahamianBangladeshiBarbadianBasqueBelgianBelizeanBermudanBhutaneseBlackfeetBolivianBrazilianBritishBritish West IndianBulgarianBurmeseCajunCambodianCanadianCape VerdeanCarpatho RusynCelticCentral AmericanCentral American IndianCherokeeCheyenneChickasawChileanChineseChippewaChoctawColombianColvilleComancheCosta RicanCreeCreekCroatianCrowCubanCypriotCzechCzechoslovakianDanishDelawareDominicanDutchDutch West IndianEastern EuropeanEcuadorianEgyptianEnglishEstonianEthiopianEuropeanFijianFilipinoFinnishFrenchFrench American IndianFrench CanadianGermanGerman RussianGhanaianGreekGuamanian/ChamorroGuatemalanGuyaneseHaitianHmongHonduranHopiHoumaHungarianIcelanderIndian (Asian)IndonesianInupiatIranianIraqiIrishIroquoisIsraeliItalianJamaicanJapaneseJordanianKenyanKiowaKoreanLaotianLatvianLebaneseLiberianLithuanianLumbeeLuxembourgerMacedonianMalaysianMalteseMarshalleseMenomineeMexicanMexican American IndianMongolianMoroccanNative HawaiianNavajoNepaleseNew ZealanderNicaraguanNigerianNorthern EuropeanNorwegianOkinawanOsageOttawaPaiutePakistaniPalestinianPanamanianParaguayanPennsylvania GermanPeruvianPimaPolishPortuguesePotawatomiPuebloPuerto RicanPuget Sound SalishRomanianRussianSalvadoranSamoanScandinavianScotch-IrishScottishSeminoleSenegaleseSerbianShoshoneSierra LeoneanSiouxSlavicSlovakSloveneSomaliSouth AfricanSouth AmericanSouth American IndianSoviet UnionSpaniardSpanishSpanish AmericanSpanish American IndianSri LankanSubsaharan AfricanSudaneseSwedishSwissSyrianTaiwaneseThaiTlingit-HaidaTohono O'OdhamTonganTrinidadian and TobagonianTsimshianTurkishU.S. Virgin IslanderUgandanUkrainianUruguayanUteVenezuelanVietnameseWelshWest IndianYakamaYaquiYugoslavianYumanYup'ikZimbabwean
Immigration
NonimmigrantsImmigrantsAfghanistanAfricaAlbaniaArgentinaArmeniaAsiaAustraliaAustriaBahamasBangladeshBarbadosBelarusBelgiumBelizeBoliviaBosnia and HerzegovinaBrazilBulgariaBurma/MyanmarCabo VerdeCambodiaCameroonCanadaCaribbeanCentral AmericaChileChinaColombiaCongoCosta RicaCroatiaCubaDenmarkDominicaDominican RepublicEastern AfricaEastern AsiaEastern EuropeEcuadorEgyptEl SalvadorEnglandEritreaEthiopiaEuropeFijiFranceGermanyGhanaGreeceGrenadaGuatemalaGuyanaHaitiHondurasHong KongHungaryIndiaIndonesiaIranIraqIrelandIsraelItalyJamaicaJapanJordanKazakhstanKenyaKoreaKuwaitLaosLatin AmericaLatviaLebanonLiberiaLithuaniaMalaysiaMexicoMicronesiaMiddle AfricaMoldovaMoroccoNepalNetherlandsNicaraguaNigeriaNorth AmericaNorth MacedoniaNorthern AfricaNorthern EuropeNorwayOceaniaPakistanPanamaPeruPhilippinesPolandPortugalRomaniaRussiaSaudi ArabiaScotlandSenegalSerbiaSierra LeoneSingaporeSomaliaSouth AfricaSouth AmericaSouth Central AsiaSouth Eastern AsiaSouthern EuropeSpainSri LankaSt. Vincent and the GrenadinesSudanSwedenSwitzerlandSyriaTaiwanThailandTrinidad and TobagoTurkeyUgandaUkraineUruguayUzbekistanVenezuelaVietnamWest IndiesWestern AfricaWestern AsiaWestern EuropeYemenZaireZimbabweAzores
Child Poverty Under the Age of 5
Income
Poverty
Unemployment
Labor Participation
Family Structure
Vehicle Availability
Education Level
Disability

Child Poverty Under the Age of 5 Comparison

Immigrants from Czechoslovakia

Immigrants from Ecuador

Exceptional
Tragic
14.8%
CHILD POVERTY UNDER THE AGE OF 5
99.6/ 100
METRIC RATING
48th/ 347
METRIC RANK
19.6%
CHILD POVERTY UNDER THE AGE OF 5
0.5/ 100
METRIC RATING
240th/ 347
METRIC RANK

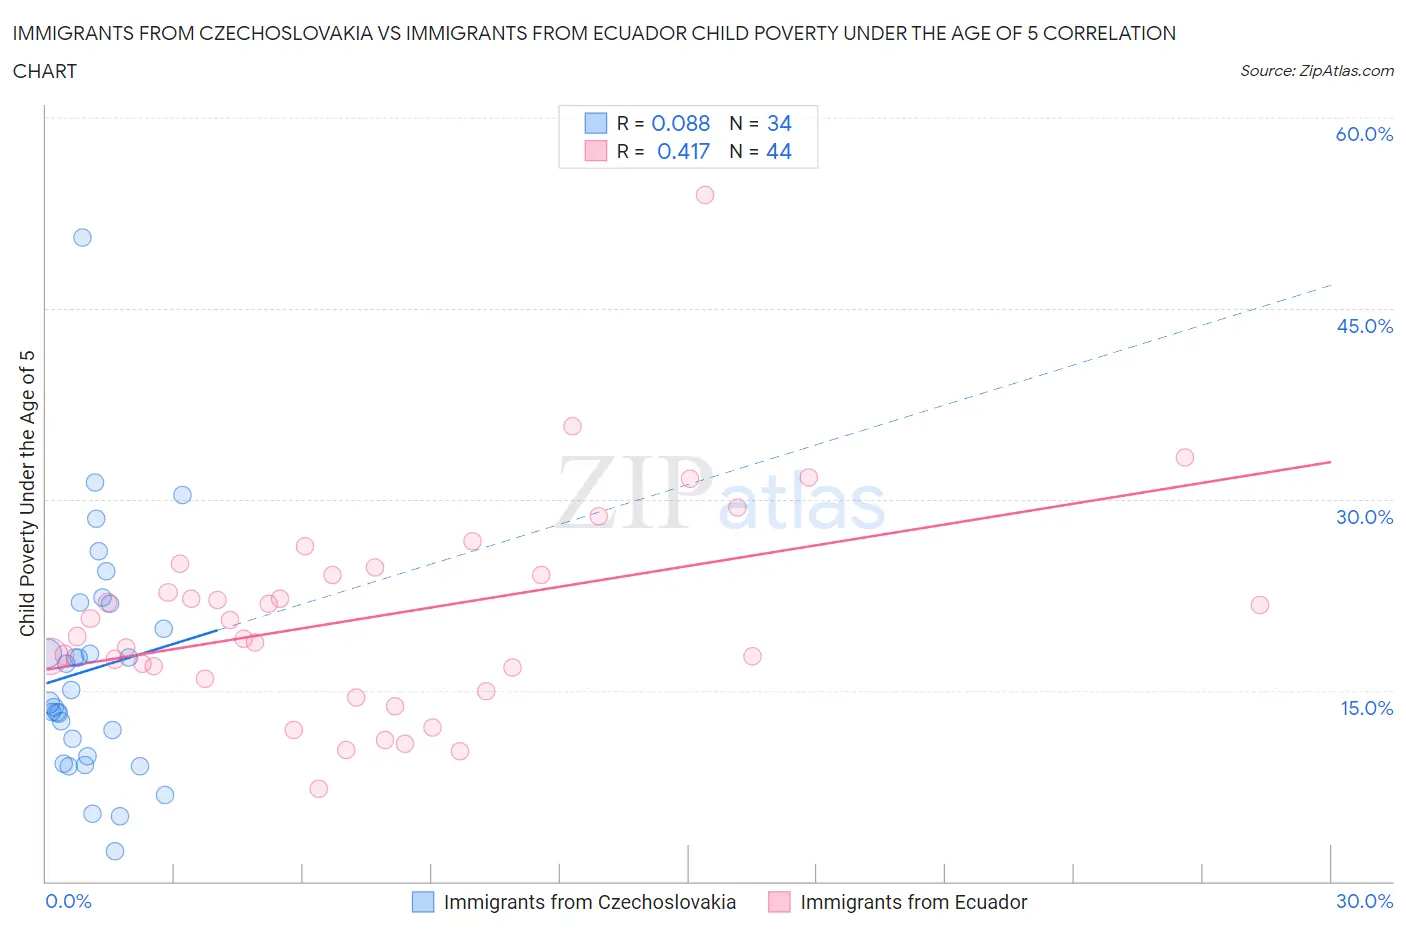
Immigrants from Czechoslovakia vs Immigrants from Ecuador Child Poverty Under the Age of 5 Correlation Chart

The statistical analysis conducted on geographies consisting of 189,024,563 people shows a slight positive correlation between the proportion of Immigrants from Czechoslovakia and poverty level among children under the age of 5 in the United States with a correlation coefficient (R) of 0.088 and weighted average of 14.8%. Similarly, the statistical analysis conducted on geographies consisting of 262,656,559 people shows a moderate positive correlation between the proportion of Immigrants from Ecuador and poverty level among children under the age of 5 in the United States with a correlation coefficient (R) of 0.417 and weighted average of 19.6%, a difference of 32.6%.
Immigrants from Czechoslovakia vs Immigrants from Ecuador Child Poverty Under the Age of 5

Child Poverty Under the Age of 5 Correlation Summary

MeasurementImmigrants from CzechoslovakiaImmigrants from Ecuador
Minimum2.3%7.3%
Maximum50.5%53.9%
Range48.2%46.6%
Mean16.7%20.9%
Median14.5%19.9%
Interquartile 25% (IQ1)9.8%16.4%
Interquartile 75% (IQ3)21.8%24.4%
Interquartile Range (IQR)12.1%8.0%
Standard Deviation (Sample)9.4%8.3%
Standard Deviation (Population)9.2%8.2%

Similar Demographics by Child Poverty Under the Age of 5

Demographics Similar to Immigrants from Czechoslovakia by Child Poverty Under the Age of 5

In terms of child poverty under the age of 5, the demographic groups most similar to Immigrants from Czechoslovakia are Russian (14.8%, a difference of 0.11%), Immigrants from Bulgaria (14.8%, a difference of 0.15%), Tsimshian (14.7%, a difference of 0.24%), Immigrants from Northern Europe (14.8%, a difference of 0.24%), and Estonian (14.8%, a difference of 0.29%).
DemographicsRating | RankChild Poverty Under the Age of 5
Immigrants | Belarus
99.7
/100
|
#41
Exceptional
14.7%
Soviet Union
99.7
/100
|
#42
Exceptional
14.7%
Immigrants | Greece
99.7
/100
|
#43
Exceptional
14.7%
Immigrants | Philippines
99.7
/100
|
#44
Exceptional
14.7%
Laotians
99.6
/100
|
#45
Exceptional
14.7%
Tsimshian
99.6
/100
|
#46
Exceptional
14.7%
Russians
99.6
/100
|
#47
Exceptional
14.8%
Immigrants | Czechoslovakia
99.6
/100
|
#48
Exceptional
14.8%
Immigrants | Bulgaria
99.6
/100
|
#49
Exceptional
14.8%
Immigrants | Northern Europe
99.6
/100
|
#50
Exceptional
14.8%
Estonians
99.6
/100
|
#51
Exceptional
14.8%
Immigrants | Serbia
99.5
/100
|
#52
Exceptional
14.9%
Luxembourgers
99.4
/100
|
#53
Exceptional
14.9%
Immigrants | Israel
99.4
/100
|
#54
Exceptional
14.9%
Danes
99.4
/100
|
#55
Exceptional
14.9%

Demographics Similar to Immigrants from Ecuador by Child Poverty Under the Age of 5

In terms of child poverty under the age of 5, the demographic groups most similar to Immigrants from Ecuador are Alaska Native (19.6%, a difference of 0.060%), Immigrants from Guyana (19.6%, a difference of 0.18%), Osage (19.6%, a difference of 0.28%), Immigrants from Ghana (19.6%, a difference of 0.30%), and Vietnamese (19.5%, a difference of 0.37%).
DemographicsRating | RankChild Poverty Under the Age of 5
Sudanese
0.9
/100
|
#233
Tragic
19.3%
Immigrants | Micronesia
0.9
/100
|
#234
Tragic
19.4%
Immigrants | Laos
0.8
/100
|
#235
Tragic
19.4%
Immigrants | Trinidad and Tobago
0.8
/100
|
#236
Tragic
19.4%
Immigrants | Cabo Verde
0.6
/100
|
#237
Tragic
19.5%
Salvadorans
0.6
/100
|
#238
Tragic
19.5%
Vietnamese
0.6
/100
|
#239
Tragic
19.5%
Immigrants | Ecuador
0.5
/100
|
#240
Tragic
19.6%
Alaska Natives
0.5
/100
|
#241
Tragic
19.6%
Immigrants | Guyana
0.5
/100
|
#242
Tragic
19.6%
Osage
0.5
/100
|
#243
Tragic
19.6%
Immigrants | Ghana
0.5
/100
|
#244
Tragic
19.6%
Immigrants | Western Africa
0.4
/100
|
#245
Tragic
19.7%
Cree
0.4
/100
|
#246
Tragic
19.7%
Guyanese
0.4
/100
|
#247
Tragic
19.7%