Immigrants from Czechoslovakia vs Cambodian Single Mother Poverty

COMPARE

Immigrants from Czechoslovakia
Race
Ancestry
AfghanAfricanAlaska NativeAlaskan AthabascanAlbanianAleutAlsatianAmericanApacheArabArapahoArgentineanArmenianAssyrian/Chaldean/SyriacAustralianAustrianBahamianBangladeshiBarbadianBasqueBelgianBelizeanBermudanBhutaneseBlackfeetBolivianBrazilianBritishBritish West IndianBulgarianBurmeseCajunCanadianCape VerdeanCarpatho RusynCelticCentral AmericanCentral American IndianCherokeeCheyenneChickasawChileanChineseChippewaChoctawColombianColvilleComancheCosta RicanCreeCreekCroatianCrowCubanCypriotCzechCzechoslovakianDanishDelawareDominicanDutchDutch West IndianEastern EuropeanEcuadorianEgyptianEnglishEstonianEthiopianEuropeanFijianFilipinoFinnishFrenchFrench American IndianFrench CanadianGermanGerman RussianGhanaianGreekGuamanian/ChamorroGuatemalanGuyaneseHaitianHmongHonduranHopiHoumaHungarianIcelanderIndian (Asian)IndonesianInupiatIranianIraqiIrishIroquoisIsraeliItalianJamaicanJapaneseJordanianKenyanKiowaKoreanLaotianLatvianLebaneseLiberianLithuanianLumbeeLuxembourgerMacedonianMalaysianMalteseMarshalleseMenomineeMexicanMexican American IndianMongolianMoroccanNative HawaiianNavajoNepaleseNew ZealanderNicaraguanNigerianNorthern EuropeanNorwegianOkinawanOsageOttawaPaiutePakistaniPalestinianPanamanianParaguayanPennsylvania GermanPeruvianPimaPolishPortuguesePotawatomiPuebloPuerto RicanPuget Sound SalishRomanianRussianSalvadoranSamoanScandinavianScotch-IrishScottishSeminoleSenegaleseSerbianShoshoneSierra LeoneanSiouxSlavicSlovakSloveneSomaliSouth AfricanSouth AmericanSouth American IndianSoviet UnionSpaniardSpanishSpanish AmericanSpanish American IndianSri LankanSubsaharan AfricanSudaneseSwedishSwissSyrianTaiwaneseThaiTlingit-HaidaTohono O'OdhamTonganTrinidadian and TobagonianTsimshianTurkishU.S. Virgin IslanderUgandanUkrainianUruguayanUteVenezuelanVietnameseWelshWest IndianYakamaYaquiYugoslavianYumanYup'ikZimbabwean
Immigration
NonimmigrantsImmigrantsAfghanistanAfricaAlbaniaArgentinaArmeniaAsiaAustraliaAustriaBahamasBangladeshBarbadosBelarusBelgiumBelizeBoliviaBosnia and HerzegovinaBrazilBulgariaBurma/MyanmarCabo VerdeCambodiaCameroonCanadaCaribbeanCentral AmericaChileChinaColombiaCongoCosta RicaCroatiaCubaCzechoslovakiaDenmarkDominicaDominican RepublicEastern AfricaEastern AsiaEastern EuropeEcuadorEgyptEl SalvadorEnglandEritreaEthiopiaEuropeFijiFranceGermanyGhanaGreeceGrenadaGuatemalaGuyanaHaitiHondurasHong KongHungaryIndiaIndonesiaIranIraqIrelandIsraelItalyJamaicaJapanJordanKazakhstanKenyaKoreaKuwaitLaosLatin AmericaLatviaLebanonLiberiaLithuaniaMalaysiaMexicoMicronesiaMiddle AfricaMoldovaMoroccoNepalNetherlandsNicaraguaNigeriaNorth AmericaNorth MacedoniaNorthern AfricaNorthern EuropeNorwayOceaniaPakistanPanamaPeruPhilippinesPolandPortugalRomaniaRussiaSaudi ArabiaScotlandSenegalSerbiaSierra LeoneSingaporeSomaliaSouth AfricaSouth AmericaSouth Central AsiaSouth Eastern AsiaSouthern EuropeSpainSri LankaSt. Vincent and the GrenadinesSudanSwedenSwitzerlandSyriaTaiwanThailandTrinidad and TobagoTurkeyUgandaUkraineUruguayUzbekistanVenezuelaVietnamWest IndiesWestern AfricaWestern AsiaWestern EuropeYemenZaireZimbabweAzores
Cambodian
Race
Ancestry
AfghanAfricanAlaska NativeAlaskan AthabascanAlbanianAleutAlsatianAmericanApacheArabArapahoArgentineanArmenianAssyrian/Chaldean/SyriacAustralianAustrianBahamianBangladeshiBarbadianBasqueBelgianBelizeanBermudanBhutaneseBlackfeetBolivianBrazilianBritishBritish West IndianBulgarianBurmeseCajunCambodianCanadianCape VerdeanCarpatho RusynCelticCentral AmericanCentral American IndianCherokeeCheyenneChickasawChileanChineseChippewaChoctawColombianColvilleComancheCosta RicanCreeCreekCroatianCrowCubanCypriotCzechCzechoslovakianDanishDelawareDominicanDutchDutch West IndianEastern EuropeanEcuadorianEgyptianEnglishEstonianEthiopianEuropeanFijianFilipinoFinnishFrenchFrench American IndianFrench CanadianGermanGerman RussianGhanaianGreekGuamanian/ChamorroGuatemalanGuyaneseHaitianHmongHonduranHopiHoumaHungarianIcelanderIndian (Asian)IndonesianInupiatIranianIraqiIrishIroquoisIsraeliItalianJamaicanJapaneseJordanianKenyanKiowaKoreanLaotianLatvianLebaneseLiberianLithuanianLumbeeLuxembourgerMacedonianMalaysianMalteseMarshalleseMenomineeMexicanMexican American IndianMongolianMoroccanNative HawaiianNavajoNepaleseNew ZealanderNicaraguanNigerianNorthern EuropeanNorwegianOkinawanOsageOttawaPaiutePakistaniPalestinianPanamanianParaguayanPennsylvania GermanPeruvianPimaPolishPortuguesePotawatomiPuebloPuerto RicanPuget Sound SalishRomanianRussianSalvadoranSamoanScandinavianScotch-IrishScottishSeminoleSenegaleseSerbianShoshoneSierra LeoneanSiouxSlavicSlovakSloveneSomaliSouth AfricanSouth AmericanSouth American IndianSoviet UnionSpaniardSpanishSpanish AmericanSpanish American IndianSri LankanSubsaharan AfricanSudaneseSwedishSwissSyrianTaiwaneseThaiTlingit-HaidaTohono O'OdhamTonganTrinidadian and TobagonianTsimshianTurkishU.S. Virgin IslanderUgandanUkrainianUruguayanUteVenezuelanVietnameseWelshWest IndianYakamaYaquiYugoslavianYumanYup'ikZimbabwean
Immigration
NonimmigrantsImmigrantsAfghanistanAfricaAlbaniaArgentinaArmeniaAsiaAustraliaAustriaBahamasBangladeshBarbadosBelarusBelgiumBelizeBoliviaBosnia and HerzegovinaBrazilBulgariaBurma/MyanmarCabo VerdeCambodiaCameroonCanadaCaribbeanCentral AmericaChileChinaColombiaCongoCosta RicaCroatiaCubaDenmarkDominicaDominican RepublicEastern AfricaEastern AsiaEastern EuropeEcuadorEgyptEl SalvadorEnglandEritreaEthiopiaEuropeFijiFranceGermanyGhanaGreeceGrenadaGuatemalaGuyanaHaitiHondurasHong KongHungaryIndiaIndonesiaIranIraqIrelandIsraelItalyJamaicaJapanJordanKazakhstanKenyaKoreaKuwaitLaosLatin AmericaLatviaLebanonLiberiaLithuaniaMalaysiaMexicoMicronesiaMiddle AfricaMoldovaMoroccoNepalNetherlandsNicaraguaNigeriaNorth AmericaNorth MacedoniaNorthern AfricaNorthern EuropeNorwayOceaniaPakistanPanamaPeruPhilippinesPolandPortugalRomaniaRussiaSaudi ArabiaScotlandSenegalSerbiaSierra LeoneSingaporeSomaliaSouth AfricaSouth AmericaSouth Central AsiaSouth Eastern AsiaSouthern EuropeSpainSri LankaSt. Vincent and the GrenadinesSudanSwedenSwitzerlandSyriaTaiwanThailandTrinidad and TobagoTurkeyUgandaUkraineUruguayUzbekistanVenezuelaVietnamWest IndiesWestern AfricaWestern AsiaWestern EuropeYemenZaireZimbabweAzores
Single Mother Poverty
Income
Poverty
Unemployment
Labor Participation
Family Structure
Vehicle Availability
Education Level
Disability

Single Mother Poverty Comparison

Immigrants from Czechoslovakia

Cambodians

Exceptional
Exceptional
27.4%
SINGLE MOTHER POVERTY
99.5/ 100
METRIC RATING
68th/ 347
METRIC RANK
27.0%
SINGLE MOTHER POVERTY
99.8/ 100
METRIC RATING
49th/ 347
METRIC RANK

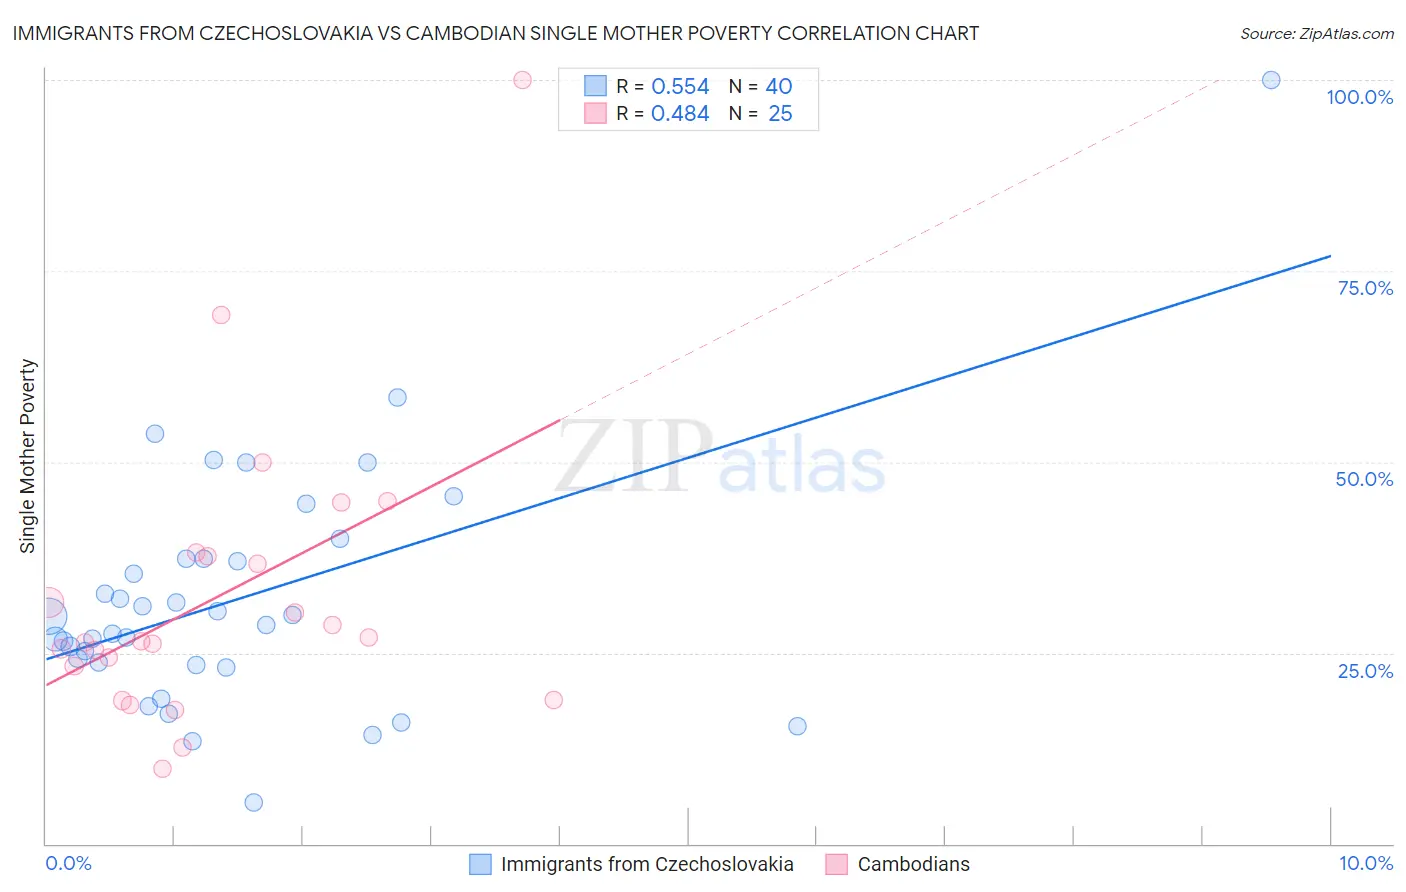
Immigrants from Czechoslovakia vs Cambodian Single Mother Poverty Correlation Chart

The statistical analysis conducted on geographies consisting of 191,942,297 people shows a substantial positive correlation between the proportion of Immigrants from Czechoslovakia and poverty level among single mothers in the United States with a correlation coefficient (R) of 0.554 and weighted average of 27.4%. Similarly, the statistical analysis conducted on geographies consisting of 101,772,823 people shows a moderate positive correlation between the proportion of Cambodians and poverty level among single mothers in the United States with a correlation coefficient (R) of 0.484 and weighted average of 27.0%, a difference of 1.5%.
Immigrants from Czechoslovakia vs Cambodian Single Mother Poverty

Single Mother Poverty Correlation Summary

MeasurementImmigrants from CzechoslovakiaCambodian
Minimum5.4%9.8%
Maximum100.0%100.0%
Range94.6%90.2%
Mean32.1%32.5%
Median29.1%26.5%
Interquartile 25% (IQ1)23.6%21.0%
Interquartile 75% (IQ3)37.3%37.8%
Interquartile Range (IQR)13.7%16.8%
Standard Deviation (Sample)16.2%19.1%
Standard Deviation (Population)16.0%18.7%

Demographics Similar to Immigrants from Czechoslovakia and Cambodians by Single Mother Poverty

In terms of single mother poverty, the demographic groups most similar to Immigrants from Czechoslovakia are Immigrants from Australia (27.3%, a difference of 0.030%), Soviet Union (27.3%, a difference of 0.050%), Immigrants from Turkey (27.3%, a difference of 0.090%), Russian (27.3%, a difference of 0.17%), and Immigrants from Northern Europe (27.3%, a difference of 0.20%). Similarly, the demographic groups most similar to Cambodians are Laotian (27.0%, a difference of 0.010%), Immigrants from Poland (26.9%, a difference of 0.080%), Immigrants from Argentina (27.1%, a difference of 0.56%), Immigrants from South Eastern Asia (27.1%, a difference of 0.60%), and Immigrants from Jordan (27.1%, a difference of 0.64%).
DemographicsRating | RankSingle Mother Poverty
Immigrants | Poland
99.8
/100
|
#48
Exceptional
26.9%
Cambodians
99.8
/100
|
#49
Exceptional
27.0%
Laotians
99.8
/100
|
#50
Exceptional
27.0%
Immigrants | Argentina
99.7
/100
|
#51
Exceptional
27.1%
Immigrants | South Eastern Asia
99.7
/100
|
#52
Exceptional
27.1%
Immigrants | Jordan
99.7
/100
|
#53
Exceptional
27.1%
Immigrants | Bulgaria
99.7
/100
|
#54
Exceptional
27.1%
Immigrants | Egypt
99.7
/100
|
#55
Exceptional
27.1%
Immigrants | Romania
99.7
/100
|
#56
Exceptional
27.2%
Palestinians
99.7
/100
|
#57
Exceptional
27.2%
Argentineans
99.6
/100
|
#58
Exceptional
27.2%
Paraguayans
99.6
/100
|
#59
Exceptional
27.2%
Eastern Europeans
99.6
/100
|
#60
Exceptional
27.2%
Immigrants | Eastern Europe
99.6
/100
|
#61
Exceptional
27.2%
Immigrants | Malaysia
99.5
/100
|
#62
Exceptional
27.3%
Immigrants | Northern Europe
99.5
/100
|
#63
Exceptional
27.3%
Russians
99.5
/100
|
#64
Exceptional
27.3%
Immigrants | Turkey
99.5
/100
|
#65
Exceptional
27.3%
Soviet Union
99.5
/100
|
#66
Exceptional
27.3%
Immigrants | Australia
99.5
/100
|
#67
Exceptional
27.3%
Immigrants | Czechoslovakia
99.5
/100
|
#68
Exceptional
27.4%