Immigrants from Croatia vs British West Indian Poverty
COMPARE
Immigrants from Croatia
British West Indian
Poverty
Poverty Comparison
Immigrants from Croatia
British West Indians
11.0%
POVERTY
98.7/ 100
METRIC RATING
51st/ 347
METRIC RANK
15.9%
POVERTY
0.0/ 100
METRIC RATING
315th/ 347
METRIC RANK
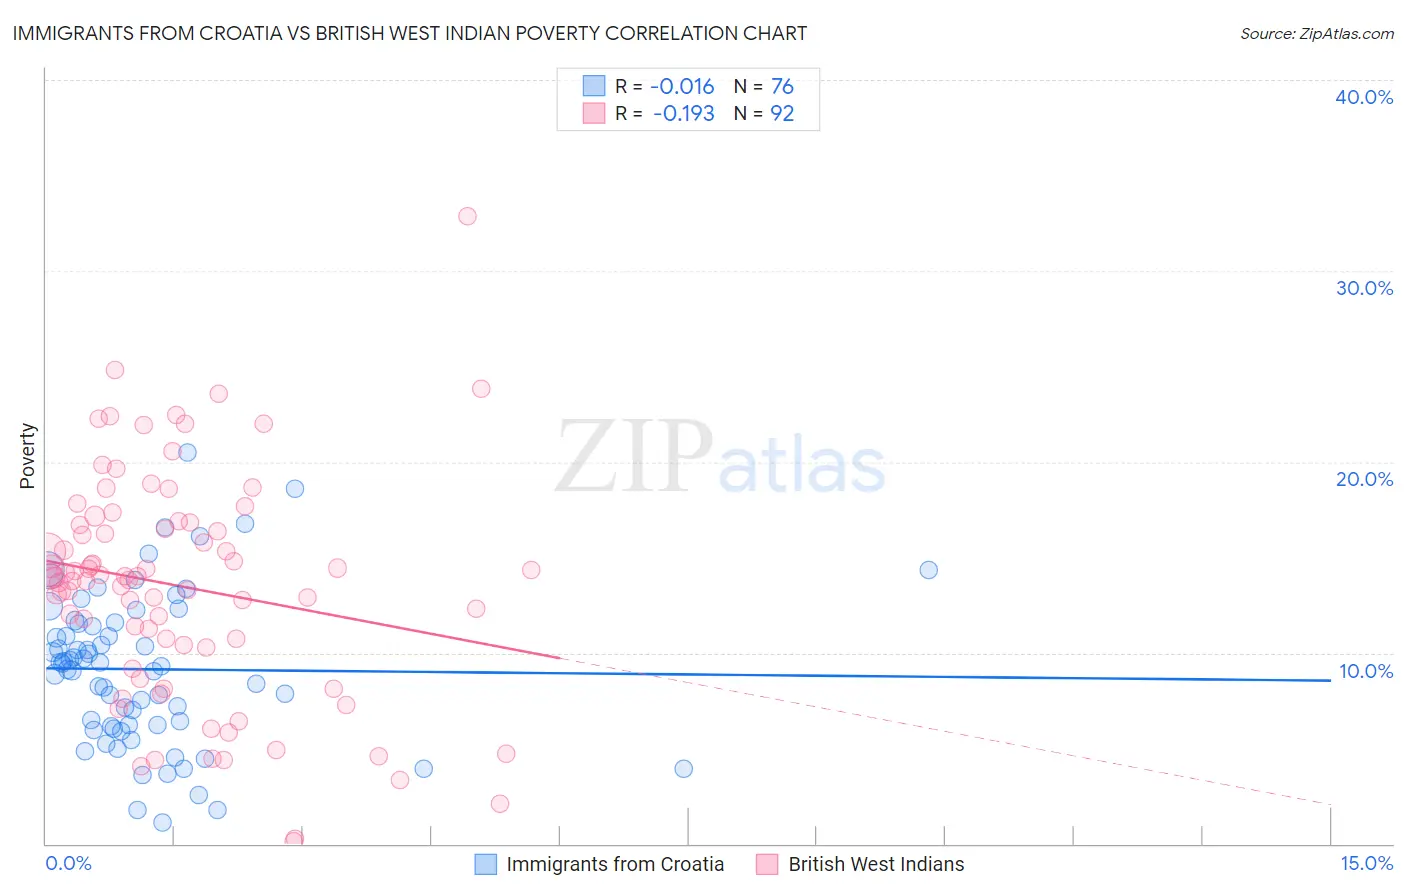
Immigrants from Croatia vs British West Indian Poverty Correlation Chart
The statistical analysis conducted on geographies consisting of 132,563,903 people shows no correlation between the proportion of Immigrants from Croatia and poverty level in the United States with a correlation coefficient (R) of -0.016 and weighted average of 11.0%. Similarly, the statistical analysis conducted on geographies consisting of 152,630,673 people shows a poor negative correlation between the proportion of British West Indians and poverty level in the United States with a correlation coefficient (R) of -0.193 and weighted average of 15.9%, a difference of 43.8%.
Poverty Correlation Summary
| Measurement | Immigrants from Croatia | British West Indian |
| Minimum | 1.1% | 0.13% |
| Maximum | 20.5% | 32.9% |
| Range | 19.4% | 32.8% |
| Mean | 9.1% | 13.5% |
| Median | 9.4% | 14.0% |
| Interquartile 25% (IQ1) | 6.2% | 10.3% |
| Interquartile 75% (IQ3) | 11.6% | 16.8% |
| Interquartile Range (IQR) | 5.4% | 6.4% |
| Standard Deviation (Sample) | 4.0% | 5.9% |
| Standard Deviation (Population) | 4.0% | 5.9% |
Similar Demographics by Poverty
Demographics Similar to Immigrants from Croatia by Poverty
In terms of poverty, the demographic groups most similar to Immigrants from Croatia are Immigrants from Philippines (11.0%, a difference of 0.020%), Immigrants from Austria (11.1%, a difference of 0.24%), Immigrants from Bulgaria (11.1%, a difference of 0.36%), Immigrants from Serbia (11.1%, a difference of 0.39%), and Asian (11.0%, a difference of 0.41%).
| Demographics | Rating | Rank | Poverty |
| Immigrants | Moldova | 99.1 /100 | #44 | Exceptional 10.9% |
| Turks | 98.9 /100 | #45 | Exceptional 11.0% |
| Immigrants | Czechoslovakia | 98.9 /100 | #46 | Exceptional 11.0% |
| Immigrants | Romania | 98.9 /100 | #47 | Exceptional 11.0% |
| Slovenes | 98.9 /100 | #48 | Exceptional 11.0% |
| Immigrants | Japan | 98.9 /100 | #49 | Exceptional 11.0% |
| Asians | 98.9 /100 | #50 | Exceptional 11.0% |
| Immigrants | Croatia | 98.7 /100 | #51 | Exceptional 11.0% |
| Immigrants | Philippines | 98.7 /100 | #52 | Exceptional 11.0% |
| Immigrants | Austria | 98.6 /100 | #53 | Exceptional 11.1% |
| Immigrants | Bulgaria | 98.5 /100 | #54 | Exceptional 11.1% |
| Immigrants | Serbia | 98.5 /100 | #55 | Exceptional 11.1% |
| Estonians | 98.2 /100 | #56 | Exceptional 11.1% |
| Scandinavians | 98.2 /100 | #57 | Exceptional 11.1% |
| Germans | 98.1 /100 | #58 | Exceptional 11.1% |
Demographics Similar to British West Indians by Poverty
In terms of poverty, the demographic groups most similar to British West Indians are Honduran (15.9%, a difference of 0.0%), Immigrants from Somalia (15.8%, a difference of 0.37%), Immigrants from Grenada (15.8%, a difference of 0.49%), Cajun (15.7%, a difference of 0.93%), and Chippewa (15.7%, a difference of 1.1%).
| Demographics | Rating | Rank | Poverty |
| Choctaw | 0.0 /100 | #308 | Tragic 15.6% |
| Seminole | 0.0 /100 | #309 | Tragic 15.6% |
| Dutch West Indians | 0.0 /100 | #310 | Tragic 15.6% |
| Chippewa | 0.0 /100 | #311 | Tragic 15.7% |
| Cajuns | 0.0 /100 | #312 | Tragic 15.7% |
| Immigrants | Grenada | 0.0 /100 | #313 | Tragic 15.8% |
| Immigrants | Somalia | 0.0 /100 | #314 | Tragic 15.8% |
| British West Indians | 0.0 /100 | #315 | Tragic 15.9% |
| Hondurans | 0.0 /100 | #316 | Tragic 15.9% |
| U.S. Virgin Islanders | 0.0 /100 | #317 | Tragic 16.1% |
| Immigrants | Dominica | 0.0 /100 | #318 | Tragic 16.1% |
| Immigrants | Congo | 0.0 /100 | #319 | Tragic 16.1% |
| Immigrants | Honduras | 0.0 /100 | #320 | Tragic 16.2% |
| Arapaho | 0.0 /100 | #321 | Tragic 16.3% |
| Menominee | 0.0 /100 | #322 | Tragic 16.4% |