Immigrants from Costa Rica vs Somali Child Poverty Among Girls Under 16
COMPARE
Immigrants from Costa Rica
Somali
Child Poverty Among Girls Under 16
Child Poverty Among Girls Under 16 Comparison
Immigrants from Costa Rica
Somalis
17.0%
CHILD POVERTY AMONG GIRLS UNDER 16
25.6/ 100
METRIC RATING
195th/ 347
METRIC RANK
21.0%
CHILD POVERTY AMONG GIRLS UNDER 16
0.0/ 100
METRIC RATING
300th/ 347
METRIC RANK
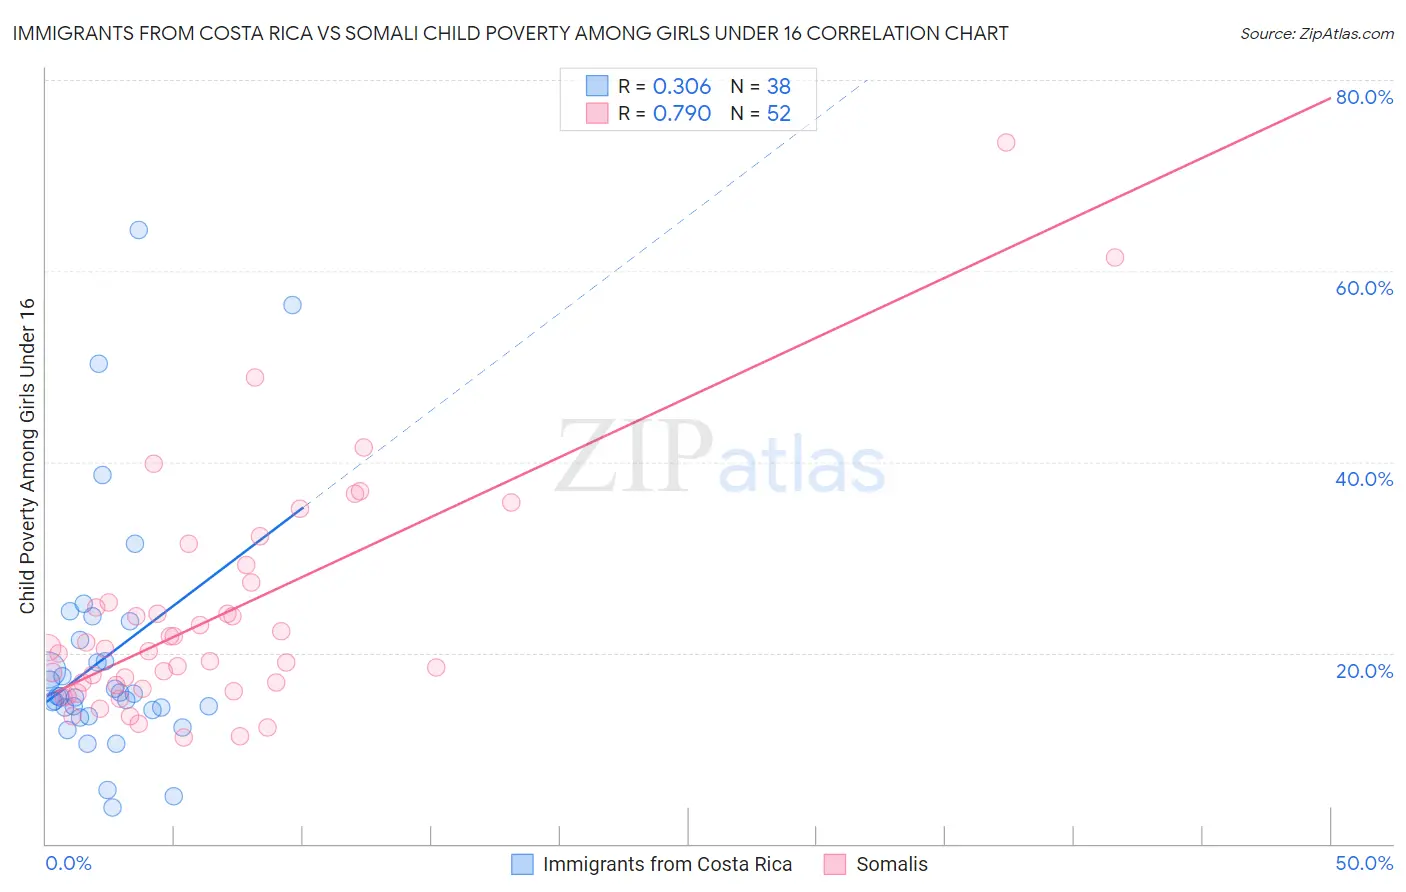
Immigrants from Costa Rica vs Somali Child Poverty Among Girls Under 16 Correlation Chart
The statistical analysis conducted on geographies consisting of 202,693,762 people shows a mild positive correlation between the proportion of Immigrants from Costa Rica and poverty level among girls under the age of 16 in the United States with a correlation coefficient (R) of 0.306 and weighted average of 17.0%. Similarly, the statistical analysis conducted on geographies consisting of 99,045,877 people shows a strong positive correlation between the proportion of Somalis and poverty level among girls under the age of 16 in the United States with a correlation coefficient (R) of 0.790 and weighted average of 21.0%, a difference of 23.8%.
Child Poverty Among Girls Under 16 Correlation Summary
| Measurement | Immigrants from Costa Rica | Somali |
| Minimum | 3.7% | 11.1% |
| Maximum | 64.3% | 73.5% |
| Range | 60.5% | 62.4% |
| Mean | 19.6% | 23.9% |
| Median | 15.5% | 20.3% |
| Interquartile 25% (IQ1) | 14.1% | 16.4% |
| Interquartile 75% (IQ3) | 21.3% | 26.3% |
| Interquartile Range (IQR) | 7.2% | 9.9% |
| Standard Deviation (Sample) | 13.0% | 12.2% |
| Standard Deviation (Population) | 12.8% | 12.1% |
Similar Demographics by Child Poverty Among Girls Under 16
Demographics Similar to Immigrants from Costa Rica by Child Poverty Among Girls Under 16
In terms of child poverty among girls under 16, the demographic groups most similar to Immigrants from Costa Rica are Celtic (17.0%, a difference of 0.050%), Spaniard (17.0%, a difference of 0.11%), Spanish (16.9%, a difference of 0.43%), Aleut (16.9%, a difference of 0.44%), and Immigrants from Lebanon (17.1%, a difference of 0.46%).
| Demographics | Rating | Rank | Child Poverty Among Girls Under 16 |
| Arabs | 34.5 /100 | #188 | Fair 16.8% |
| Immigrants | Bosnia and Herzegovina | 32.5 /100 | #189 | Fair 16.8% |
| Kenyans | 32.3 /100 | #190 | Fair 16.8% |
| Immigrants | Azores | 31.3 /100 | #191 | Fair 16.8% |
| Immigrants | Uganda | 31.3 /100 | #192 | Fair 16.8% |
| Aleuts | 28.7 /100 | #193 | Fair 16.9% |
| Spanish | 28.6 /100 | #194 | Fair 16.9% |
| Immigrants | Costa Rica | 25.6 /100 | #195 | Fair 17.0% |
| Celtics | 25.2 /100 | #196 | Fair 17.0% |
| Spaniards | 24.9 /100 | #197 | Fair 17.0% |
| Immigrants | Lebanon | 22.6 /100 | #198 | Fair 17.1% |
| Immigrants | Afghanistan | 22.4 /100 | #199 | Fair 17.1% |
| Immigrants | Uzbekistan | 21.5 /100 | #200 | Fair 17.1% |
| Immigrants | Kenya | 17.8 /100 | #201 | Poor 17.2% |
| Immigrants | Sierra Leone | 17.6 /100 | #202 | Poor 17.2% |
Demographics Similar to Somalis by Child Poverty Among Girls Under 16
In terms of child poverty among girls under 16, the demographic groups most similar to Somalis are Hispanic or Latino (21.0%, a difference of 0.31%), Choctaw (21.1%, a difference of 0.62%), Mexican (20.9%, a difference of 0.72%), Seminole (21.2%, a difference of 0.73%), and British West Indian (21.3%, a difference of 1.2%).
| Demographics | Rating | Rank | Child Poverty Among Girls Under 16 |
| Immigrants | Grenada | 0.0 /100 | #293 | Tragic 20.7% |
| Immigrants | Senegal | 0.0 /100 | #294 | Tragic 20.7% |
| Immigrants | Caribbean | 0.0 /100 | #295 | Tragic 20.7% |
| Immigrants | West Indies | 0.0 /100 | #296 | Tragic 20.7% |
| Inupiat | 0.0 /100 | #297 | Tragic 20.8% |
| Mexicans | 0.0 /100 | #298 | Tragic 20.9% |
| Hispanics or Latinos | 0.0 /100 | #299 | Tragic 21.0% |
| Somalis | 0.0 /100 | #300 | Tragic 21.0% |
| Choctaw | 0.0 /100 | #301 | Tragic 21.1% |
| Seminole | 0.0 /100 | #302 | Tragic 21.2% |
| British West Indians | 0.0 /100 | #303 | Tragic 21.3% |
| Indonesians | 0.0 /100 | #304 | Tragic 21.3% |
| Guatemalans | 0.0 /100 | #305 | Tragic 21.4% |
| Immigrants | Central America | 0.0 /100 | #306 | Tragic 21.4% |
| Immigrants | Bahamas | 0.0 /100 | #307 | Tragic 21.4% |