Immigrants from Congo vs Cheyenne Female Poverty Among 25-34 Year Olds
COMPARE
Immigrants from Congo
Cheyenne
Female Poverty Among 25-34 Year Olds
Female Poverty Among 25-34 Year Olds Comparison
Immigrants from Congo
Cheyenne
16.7%
FEMALE POVERTY AMONG 25-34 YEAR OLDS
0.0/ 100
METRIC RATING
301st/ 347
METRIC RANK
19.1%
FEMALE POVERTY AMONG 25-34 YEAR OLDS
0.0/ 100
METRIC RATING
327th/ 347
METRIC RANK
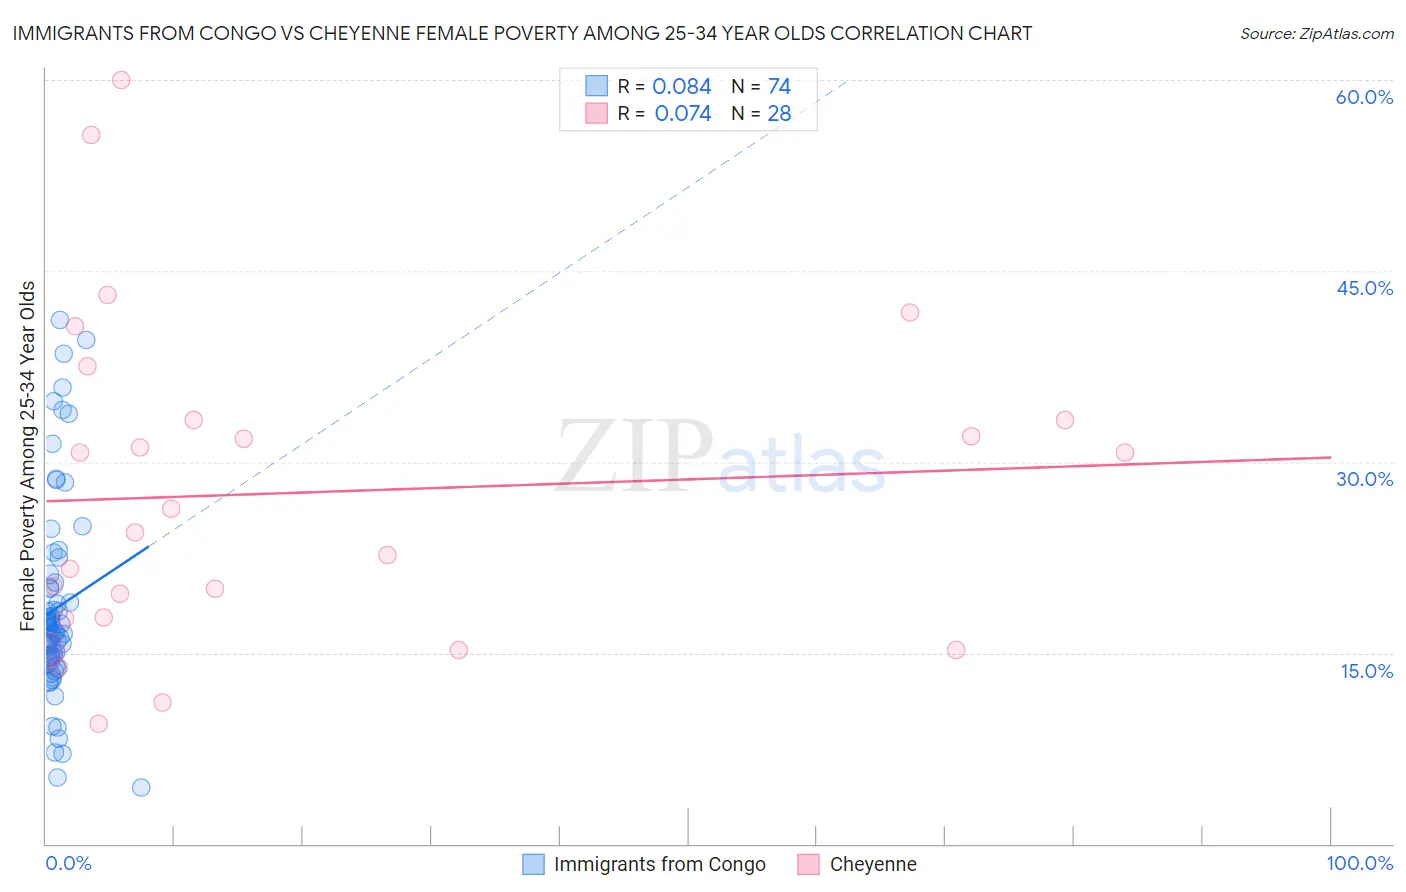
Immigrants from Congo vs Cheyenne Female Poverty Among 25-34 Year Olds Correlation Chart
The statistical analysis conducted on geographies consisting of 91,915,902 people shows a slight positive correlation between the proportion of Immigrants from Congo and poverty level among females between the ages 25 and 34 in the United States with a correlation coefficient (R) of 0.084 and weighted average of 16.7%. Similarly, the statistical analysis conducted on geographies consisting of 80,457,436 people shows a slight positive correlation between the proportion of Cheyenne and poverty level among females between the ages 25 and 34 in the United States with a correlation coefficient (R) of 0.074 and weighted average of 19.1%, a difference of 14.0%.
Female Poverty Among 25-34 Year Olds Correlation Summary
| Measurement | Immigrants from Congo | Cheyenne |
| Minimum | 4.4% | 9.4% |
| Maximum | 41.2% | 60.0% |
| Range | 36.8% | 50.6% |
| Mean | 18.5% | 27.6% |
| Median | 16.8% | 25.4% |
| Interquartile 25% (IQ1) | 14.5% | 17.7% |
| Interquartile 75% (IQ3) | 20.1% | 33.3% |
| Interquartile Range (IQR) | 5.7% | 15.6% |
| Standard Deviation (Sample) | 7.8% | 12.7% |
| Standard Deviation (Population) | 7.7% | 12.5% |
Similar Demographics by Female Poverty Among 25-34 Year Olds
Demographics Similar to Immigrants from Congo by Female Poverty Among 25-34 Year Olds
In terms of female poverty among 25-34 year olds, the demographic groups most similar to Immigrants from Congo are U.S. Virgin Islander (16.7%, a difference of 0.010%), Alaska Native (16.8%, a difference of 0.11%), Spanish American (16.7%, a difference of 0.16%), Blackfeet (16.7%, a difference of 0.20%), and Immigrants from Mexico (16.8%, a difference of 0.43%).
| Demographics | Rating | Rank | Female Poverty Among 25-34 Year Olds |
| Immigrants | Central America | 0.0 /100 | #294 | Tragic 16.6% |
| Mexicans | 0.0 /100 | #295 | Tragic 16.6% |
| Hispanics or Latinos | 0.0 /100 | #296 | Tragic 16.6% |
| Immigrants | Guatemala | 0.0 /100 | #297 | Tragic 16.6% |
| Blackfeet | 0.0 /100 | #298 | Tragic 16.7% |
| Spanish Americans | 0.0 /100 | #299 | Tragic 16.7% |
| U.S. Virgin Islanders | 0.0 /100 | #300 | Tragic 16.7% |
| Immigrants | Congo | 0.0 /100 | #301 | Tragic 16.7% |
| Alaska Natives | 0.0 /100 | #302 | Tragic 16.8% |
| Immigrants | Mexico | 0.0 /100 | #303 | Tragic 16.8% |
| Hondurans | 0.0 /100 | #304 | Tragic 16.9% |
| Immigrants | Cabo Verde | 0.0 /100 | #305 | Tragic 16.9% |
| Chickasaw | 0.0 /100 | #306 | Tragic 17.0% |
| Yaqui | 0.0 /100 | #307 | Tragic 17.0% |
| Africans | 0.0 /100 | #308 | Tragic 17.0% |
Demographics Similar to Cheyenne by Female Poverty Among 25-34 Year Olds
In terms of female poverty among 25-34 year olds, the demographic groups most similar to Cheyenne are Alaskan Athabascan (19.1%, a difference of 0.080%), Creek (19.2%, a difference of 0.33%), Black/African American (18.9%, a difference of 0.96%), Paiute (19.6%, a difference of 2.6%), and Kiowa (19.7%, a difference of 3.0%).
| Demographics | Rating | Rank | Female Poverty Among 25-34 Year Olds |
| Chippewa | 0.0 /100 | #320 | Tragic 18.0% |
| Choctaw | 0.0 /100 | #321 | Tragic 18.1% |
| Central American Indians | 0.0 /100 | #322 | Tragic 18.2% |
| Seminole | 0.0 /100 | #323 | Tragic 18.3% |
| Dutch West Indians | 0.0 /100 | #324 | Tragic 18.4% |
| Inupiat | 0.0 /100 | #325 | Tragic 18.5% |
| Blacks/African Americans | 0.0 /100 | #326 | Tragic 18.9% |
| Cheyenne | 0.0 /100 | #327 | Tragic 19.1% |
| Alaskan Athabascans | 0.0 /100 | #328 | Tragic 19.1% |
| Creek | 0.0 /100 | #329 | Tragic 19.2% |
| Paiute | 0.0 /100 | #330 | Tragic 19.6% |
| Kiowa | 0.0 /100 | #331 | Tragic 19.7% |
| Immigrants | Yemen | 0.0 /100 | #332 | Tragic 19.8% |
| Cajuns | 0.0 /100 | #333 | Tragic 19.9% |
| Apache | 0.0 /100 | #334 | Tragic 20.1% |