Immigrants from Colombia vs Asian Female Poverty Among 25-34 Year Olds
COMPARE
Immigrants from Colombia
Asian
Female Poverty Among 25-34 Year Olds
Female Poverty Among 25-34 Year Olds Comparison
Immigrants from Colombia
Asians
13.3%
FEMALE POVERTY AMONG 25-34 YEAR OLDS
69.2/ 100
METRIC RATING
158th/ 347
METRIC RANK
11.4%
FEMALE POVERTY AMONG 25-34 YEAR OLDS
99.9/ 100
METRIC RATING
22nd/ 347
METRIC RANK
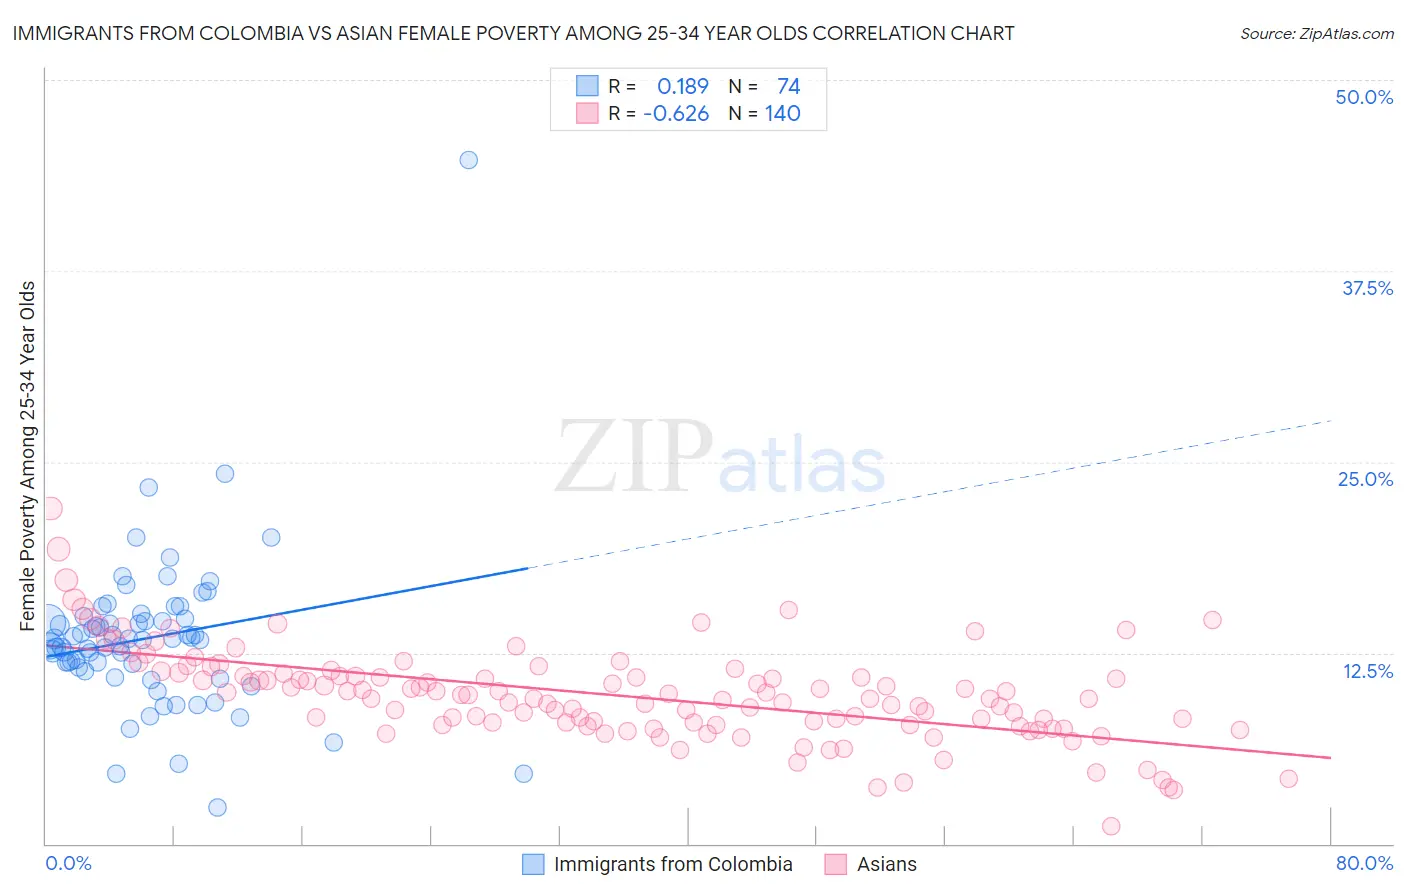
Immigrants from Colombia vs Asian Female Poverty Among 25-34 Year Olds Correlation Chart
The statistical analysis conducted on geographies consisting of 373,334,507 people shows a poor positive correlation between the proportion of Immigrants from Colombia and poverty level among females between the ages 25 and 34 in the United States with a correlation coefficient (R) of 0.189 and weighted average of 13.3%. Similarly, the statistical analysis conducted on geographies consisting of 532,990,324 people shows a significant negative correlation between the proportion of Asians and poverty level among females between the ages 25 and 34 in the United States with a correlation coefficient (R) of -0.626 and weighted average of 11.4%, a difference of 16.6%.
Female Poverty Among 25-34 Year Olds Correlation Summary
| Measurement | Immigrants from Colombia | Asian |
| Minimum | 2.4% | 1.2% |
| Maximum | 44.7% | 22.0% |
| Range | 42.4% | 20.8% |
| Mean | 13.5% | 9.7% |
| Median | 13.4% | 9.6% |
| Interquartile 25% (IQ1) | 11.5% | 7.9% |
| Interquartile 75% (IQ3) | 14.8% | 11.1% |
| Interquartile Range (IQR) | 3.2% | 3.2% |
| Standard Deviation (Sample) | 5.3% | 3.1% |
| Standard Deviation (Population) | 5.3% | 3.1% |
Similar Demographics by Female Poverty Among 25-34 Year Olds
Demographics Similar to Immigrants from Colombia by Female Poverty Among 25-34 Year Olds
In terms of female poverty among 25-34 year olds, the demographic groups most similar to Immigrants from Colombia are Immigrants from Western Europe (13.3%, a difference of 0.11%), Uruguayan (13.3%, a difference of 0.22%), Immigrants from Cameroon (13.3%, a difference of 0.28%), Immigrants from South America (13.3%, a difference of 0.28%), and Icelander (13.3%, a difference of 0.34%).
| Demographics | Rating | Rank | Female Poverty Among 25-34 Year Olds |
| Costa Ricans | 75.8 /100 | #151 | Good 13.2% |
| Slavs | 75.7 /100 | #152 | Good 13.2% |
| Northern Europeans | 73.7 /100 | #153 | Good 13.2% |
| Arabs | 73.5 /100 | #154 | Good 13.2% |
| Immigrants | Sierra Leone | 72.9 /100 | #155 | Good 13.3% |
| Immigrants | Cameroon | 72.0 /100 | #156 | Good 13.3% |
| Immigrants | Western Europe | 70.3 /100 | #157 | Good 13.3% |
| Immigrants | Colombia | 69.2 /100 | #158 | Good 13.3% |
| Uruguayans | 66.9 /100 | #159 | Good 13.3% |
| Immigrants | South America | 66.3 /100 | #160 | Good 13.3% |
| Icelanders | 65.7 /100 | #161 | Good 13.3% |
| Ugandans | 64.1 /100 | #162 | Good 13.4% |
| British | 63.5 /100 | #163 | Good 13.4% |
| Swiss | 61.7 /100 | #164 | Good 13.4% |
| Basques | 59.3 /100 | #165 | Average 13.4% |
Demographics Similar to Asians by Female Poverty Among 25-34 Year Olds
In terms of female poverty among 25-34 year olds, the demographic groups most similar to Asians are Bolivian (11.4%, a difference of 0.060%), Maltese (11.4%, a difference of 0.090%), Turkish (11.4%, a difference of 0.15%), Bhutanese (11.4%, a difference of 0.31%), and Tongan (11.5%, a difference of 0.46%).
| Demographics | Rating | Rank | Female Poverty Among 25-34 Year Olds |
| Assyrians/Chaldeans/Syriacs | 100.0 /100 | #15 | Exceptional 11.2% |
| Immigrants | Bolivia | 100.0 /100 | #16 | Exceptional 11.2% |
| Immigrants | China | 100.0 /100 | #17 | Exceptional 11.2% |
| Immigrants | Eastern Asia | 100.0 /100 | #18 | Exceptional 11.2% |
| Iranians | 100.0 /100 | #19 | Exceptional 11.2% |
| Okinawans | 100.0 /100 | #20 | Exceptional 11.3% |
| Turks | 100.0 /100 | #21 | Exceptional 11.4% |
| Asians | 99.9 /100 | #22 | Exceptional 11.4% |
| Bolivians | 99.9 /100 | #23 | Exceptional 11.4% |
| Maltese | 99.9 /100 | #24 | Exceptional 11.4% |
| Bhutanese | 99.9 /100 | #25 | Exceptional 11.4% |
| Tongans | 99.9 /100 | #26 | Exceptional 11.5% |
| Immigrants | Greece | 99.9 /100 | #27 | Exceptional 11.5% |
| Immigrants | Pakistan | 99.9 /100 | #28 | Exceptional 11.5% |
| Bulgarians | 99.9 /100 | #29 | Exceptional 11.5% |