Immigrants from China vs Immigrants from Scotland Female Poverty Among 18-24 Year Olds
COMPARE
Immigrants from China
Immigrants from Scotland
Female Poverty Among 18-24 Year Olds
Female Poverty Among 18-24 Year Olds Comparison
Immigrants from China
Immigrants from Scotland
20.2%
FEMALE POVERTY AMONG 18-24 YEAR OLDS
43.0/ 100
METRIC RATING
181st/ 347
METRIC RANK
18.6%
FEMALE POVERTY AMONG 18-24 YEAR OLDS
99.8/ 100
METRIC RATING
65th/ 347
METRIC RANK
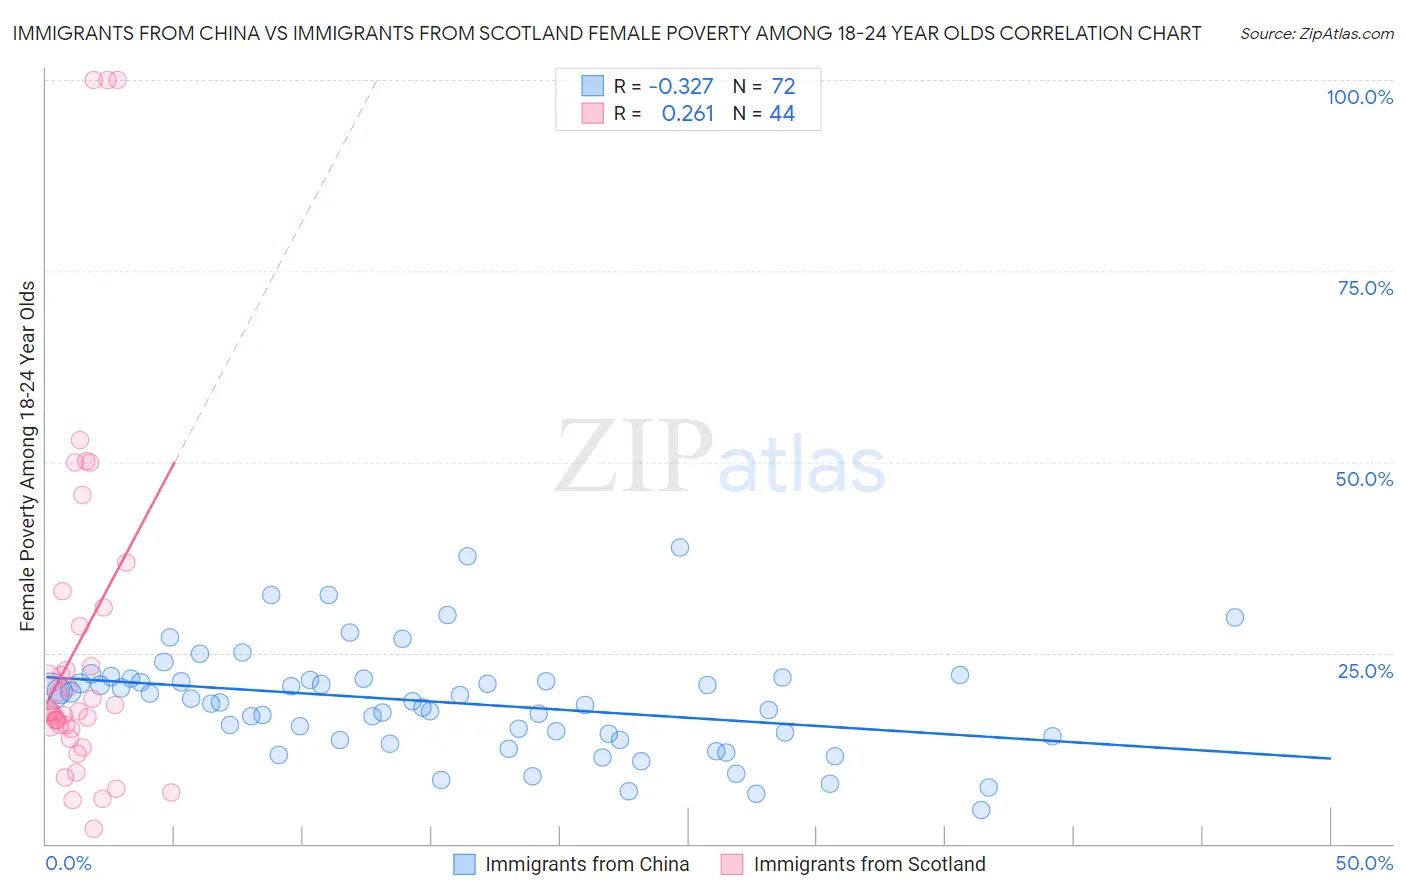
Immigrants from China vs Immigrants from Scotland Female Poverty Among 18-24 Year Olds Correlation Chart
The statistical analysis conducted on geographies consisting of 442,287,819 people shows a mild negative correlation between the proportion of Immigrants from China and poverty level among females between the ages 18 and 24 in the United States with a correlation coefficient (R) of -0.327 and weighted average of 20.2%. Similarly, the statistical analysis conducted on geographies consisting of 193,083,079 people shows a weak positive correlation between the proportion of Immigrants from Scotland and poverty level among females between the ages 18 and 24 in the United States with a correlation coefficient (R) of 0.261 and weighted average of 18.6%, a difference of 8.7%.
Female Poverty Among 18-24 Year Olds Correlation Summary
| Measurement | Immigrants from China | Immigrants from Scotland |
| Minimum | 4.3% | 2.0% |
| Maximum | 38.8% | 100.0% |
| Range | 34.4% | 98.0% |
| Mean | 18.5% | 26.3% |
| Median | 18.6% | 17.4% |
| Interquartile 25% (IQ1) | 13.9% | 15.2% |
| Interquartile 75% (IQ3) | 21.5% | 29.7% |
| Interquartile Range (IQR) | 7.6% | 14.5% |
| Standard Deviation (Sample) | 6.9% | 23.7% |
| Standard Deviation (Population) | 6.9% | 23.5% |
Similar Demographics by Female Poverty Among 18-24 Year Olds
Demographics Similar to Immigrants from China by Female Poverty Among 18-24 Year Olds
In terms of female poverty among 18-24 year olds, the demographic groups most similar to Immigrants from China are Immigrants from Barbados (20.2%, a difference of 0.010%), Iraqi (20.2%, a difference of 0.020%), Ethiopian (20.2%, a difference of 0.040%), Swiss (20.2%, a difference of 0.050%), and Immigrants from Kazakhstan (20.2%, a difference of 0.060%).
| Demographics | Rating | Rank | Female Poverty Among 18-24 Year Olds |
| Swedes | 50.0 /100 | #174 | Average 20.1% |
| South American Indians | 48.4 /100 | #175 | Average 20.1% |
| Kenyans | 44.9 /100 | #176 | Average 20.2% |
| Immigrants | Kazakhstan | 44.2 /100 | #177 | Average 20.2% |
| Swiss | 44.0 /100 | #178 | Average 20.2% |
| Ethiopians | 43.8 /100 | #179 | Average 20.2% |
| Iraqis | 43.3 /100 | #180 | Average 20.2% |
| Immigrants | China | 43.0 /100 | #181 | Average 20.2% |
| Immigrants | Barbados | 42.8 /100 | #182 | Average 20.2% |
| Lebanese | 40.6 /100 | #183 | Average 20.2% |
| Immigrants | Central America | 39.9 /100 | #184 | Fair 20.2% |
| Nepalese | 39.7 /100 | #185 | Fair 20.2% |
| Immigrants | Ethiopia | 37.3 /100 | #186 | Fair 20.2% |
| Immigrants | Mexico | 36.3 /100 | #187 | Fair 20.2% |
| Scandinavians | 34.6 /100 | #188 | Fair 20.3% |
Demographics Similar to Immigrants from Scotland by Female Poverty Among 18-24 Year Olds
In terms of female poverty among 18-24 year olds, the demographic groups most similar to Immigrants from Scotland are Immigrants from Asia (18.6%, a difference of 0.030%), Immigrants from Belarus (18.5%, a difference of 0.060%), Greek (18.5%, a difference of 0.070%), Immigrants from Albania (18.5%, a difference of 0.14%), and Jordanian (18.6%, a difference of 0.17%).
| Demographics | Rating | Rank | Female Poverty Among 18-24 Year Olds |
| Immigrants | Ukraine | 99.9 /100 | #58 | Exceptional 18.4% |
| Egyptians | 99.9 /100 | #59 | Exceptional 18.5% |
| Immigrants | Brazil | 99.8 /100 | #60 | Exceptional 18.5% |
| Immigrants | Albania | 99.8 /100 | #61 | Exceptional 18.5% |
| Greeks | 99.8 /100 | #62 | Exceptional 18.5% |
| Immigrants | Belarus | 99.8 /100 | #63 | Exceptional 18.5% |
| Immigrants | Asia | 99.8 /100 | #64 | Exceptional 18.6% |
| Immigrants | Scotland | 99.8 /100 | #65 | Exceptional 18.6% |
| Jordanians | 99.8 /100 | #66 | Exceptional 18.6% |
| Immigrants | Korea | 99.8 /100 | #67 | Exceptional 18.6% |
| Brazilians | 99.8 /100 | #68 | Exceptional 18.6% |
| Immigrants | Bulgaria | 99.7 /100 | #69 | Exceptional 18.6% |
| Immigrants | Costa Rica | 99.7 /100 | #70 | Exceptional 18.7% |
| Immigrants | Haiti | 99.7 /100 | #71 | Exceptional 18.7% |
| Armenians | 99.7 /100 | #72 | Exceptional 18.7% |