Immigrants from China vs Immigrants from Russia Seniors Poverty Over the Age of 65
COMPARE
Immigrants from China
Immigrants from Russia
Seniors Poverty Over the Age of 65
Seniors Poverty Over the Age of 65 Comparison
Immigrants from China
Immigrants from Russia
11.5%
SENIORS POVERTY OVER THE AGE OF 65
9.5/ 100
METRIC RATING
212th/ 347
METRIC RANK
11.5%
SENIORS POVERTY OVER THE AGE OF 65
8.8/ 100
METRIC RATING
214th/ 347
METRIC RANK
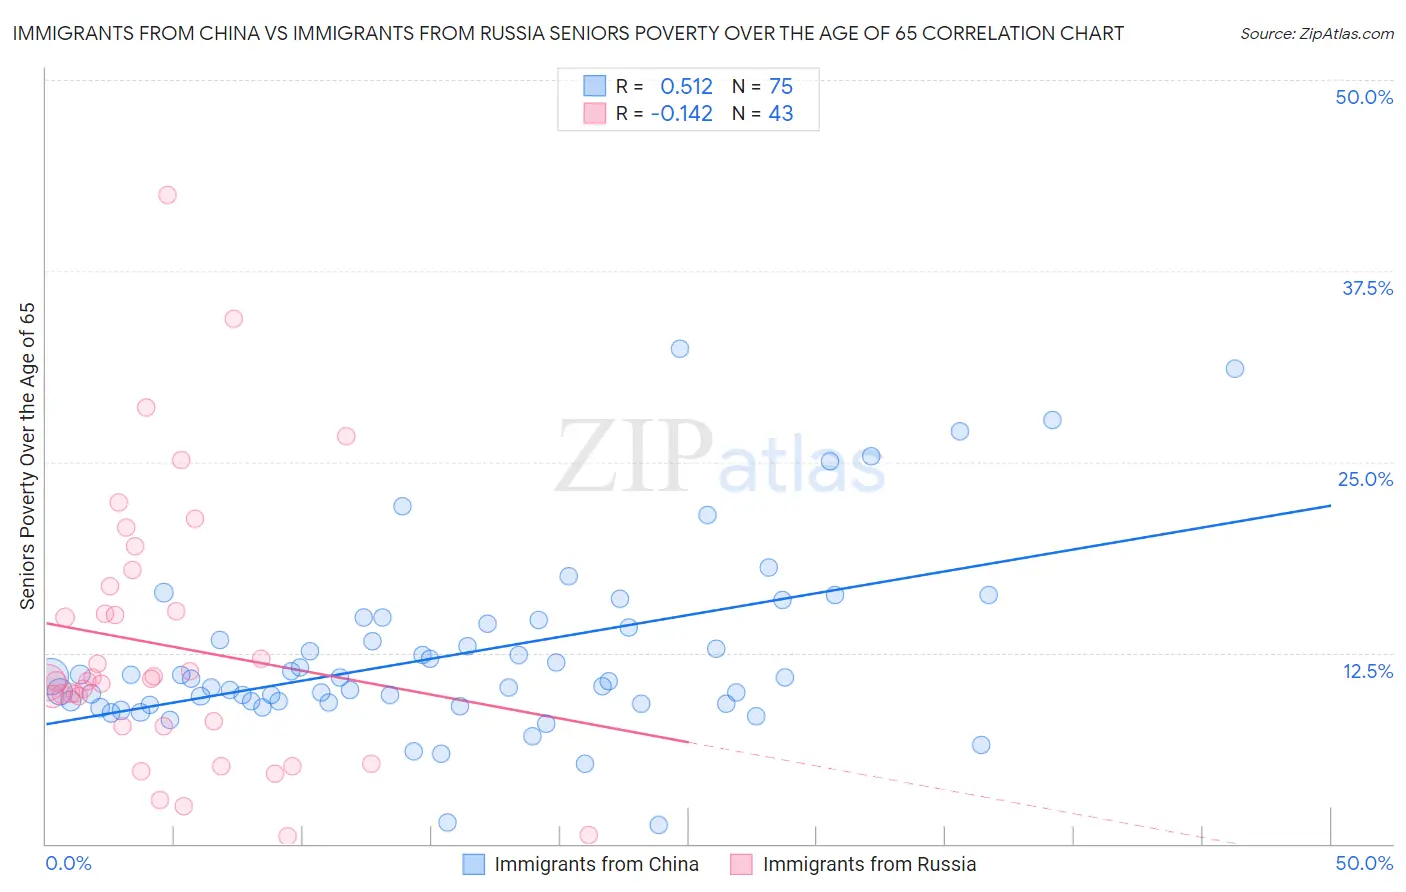
Immigrants from China vs Immigrants from Russia Seniors Poverty Over the Age of 65 Correlation Chart
The statistical analysis conducted on geographies consisting of 454,841,218 people shows a substantial positive correlation between the proportion of Immigrants from China and poverty level among seniors over the age of 65 in the United States with a correlation coefficient (R) of 0.512 and weighted average of 11.5%. Similarly, the statistical analysis conducted on geographies consisting of 346,788,548 people shows a poor negative correlation between the proportion of Immigrants from Russia and poverty level among seniors over the age of 65 in the United States with a correlation coefficient (R) of -0.142 and weighted average of 11.5%, a difference of 0.18%.
Seniors Poverty Over the Age of 65 Correlation Summary
| Measurement | Immigrants from China | Immigrants from Russia |
| Minimum | 1.2% | 0.53% |
| Maximum | 32.4% | 42.5% |
| Range | 31.2% | 41.9% |
| Mean | 12.4% | 13.0% |
| Median | 10.8% | 10.6% |
| Interquartile 25% (IQ1) | 9.2% | 7.7% |
| Interquartile 75% (IQ3) | 14.4% | 16.8% |
| Interquartile Range (IQR) | 5.2% | 9.1% |
| Standard Deviation (Sample) | 5.9% | 8.8% |
| Standard Deviation (Population) | 5.9% | 8.7% |
Demographics Similar to Immigrants from China and Immigrants from Russia by Seniors Poverty Over the Age of 65
In terms of seniors poverty over the age of 65, the demographic groups most similar to Immigrants from China are Nepalese (11.5%, a difference of 0.16%), Indonesian (11.5%, a difference of 0.20%), French American Indian (11.5%, a difference of 0.22%), Ugandan (11.4%, a difference of 0.39%), and Paraguayan (11.4%, a difference of 0.41%). Similarly, the demographic groups most similar to Immigrants from Russia are Nepalese (11.5%, a difference of 0.020%), French American Indian (11.5%, a difference of 0.040%), Indonesian (11.5%, a difference of 0.38%), Ugandan (11.4%, a difference of 0.57%), and Paraguayan (11.4%, a difference of 0.59%).
| Demographics | Rating | Rank | Seniors Poverty Over the Age of 65 |
| Immigrants | Zaire | 16.9 /100 | #203 | Poor 11.3% |
| Israelis | 16.5 /100 | #204 | Poor 11.3% |
| Brazilians | 15.4 /100 | #205 | Poor 11.3% |
| Choctaw | 14.5 /100 | #206 | Poor 11.4% |
| Immigrants | Western Asia | 13.6 /100 | #207 | Poor 11.4% |
| South American Indians | 11.7 /100 | #208 | Poor 11.4% |
| Paraguayans | 11.3 /100 | #209 | Poor 11.4% |
| Ugandans | 11.2 /100 | #210 | Poor 11.4% |
| Indonesians | 10.4 /100 | #211 | Poor 11.5% |
| Immigrants | China | 9.5 /100 | #212 | Tragic 11.5% |
| Nepalese | 8.9 /100 | #213 | Tragic 11.5% |
| Immigrants | Russia | 8.8 /100 | #214 | Tragic 11.5% |
| French American Indians | 8.7 /100 | #215 | Tragic 11.5% |
| Immigrants | Morocco | 6.8 /100 | #216 | Tragic 11.6% |
| Immigrants | Africa | 6.4 /100 | #217 | Tragic 11.6% |
| Immigrants | Ukraine | 5.7 /100 | #218 | Tragic 11.6% |
| Arapaho | 5.2 /100 | #219 | Tragic 11.6% |
| Peruvians | 4.2 /100 | #220 | Tragic 11.7% |
| Argentineans | 4.1 /100 | #221 | Tragic 11.7% |
| Immigrants | Chile | 3.9 /100 | #222 | Tragic 11.7% |
| Immigrants | Congo | 3.8 /100 | #223 | Tragic 11.7% |