Immigrants from China vs Immigrants from Nicaragua Child Poverty Among Boys Under 16
COMPARE
Immigrants from China
Immigrants from Nicaragua
Child Poverty Among Boys Under 16
Child Poverty Among Boys Under 16 Comparison
Immigrants from China
Immigrants from Nicaragua
13.6%
CHILD POVERTY AMONG BOYS UNDER 16
99.8/ 100
METRIC RATING
32nd/ 347
METRIC RANK
19.0%
CHILD POVERTY AMONG BOYS UNDER 16
0.4/ 100
METRIC RATING
246th/ 347
METRIC RANK
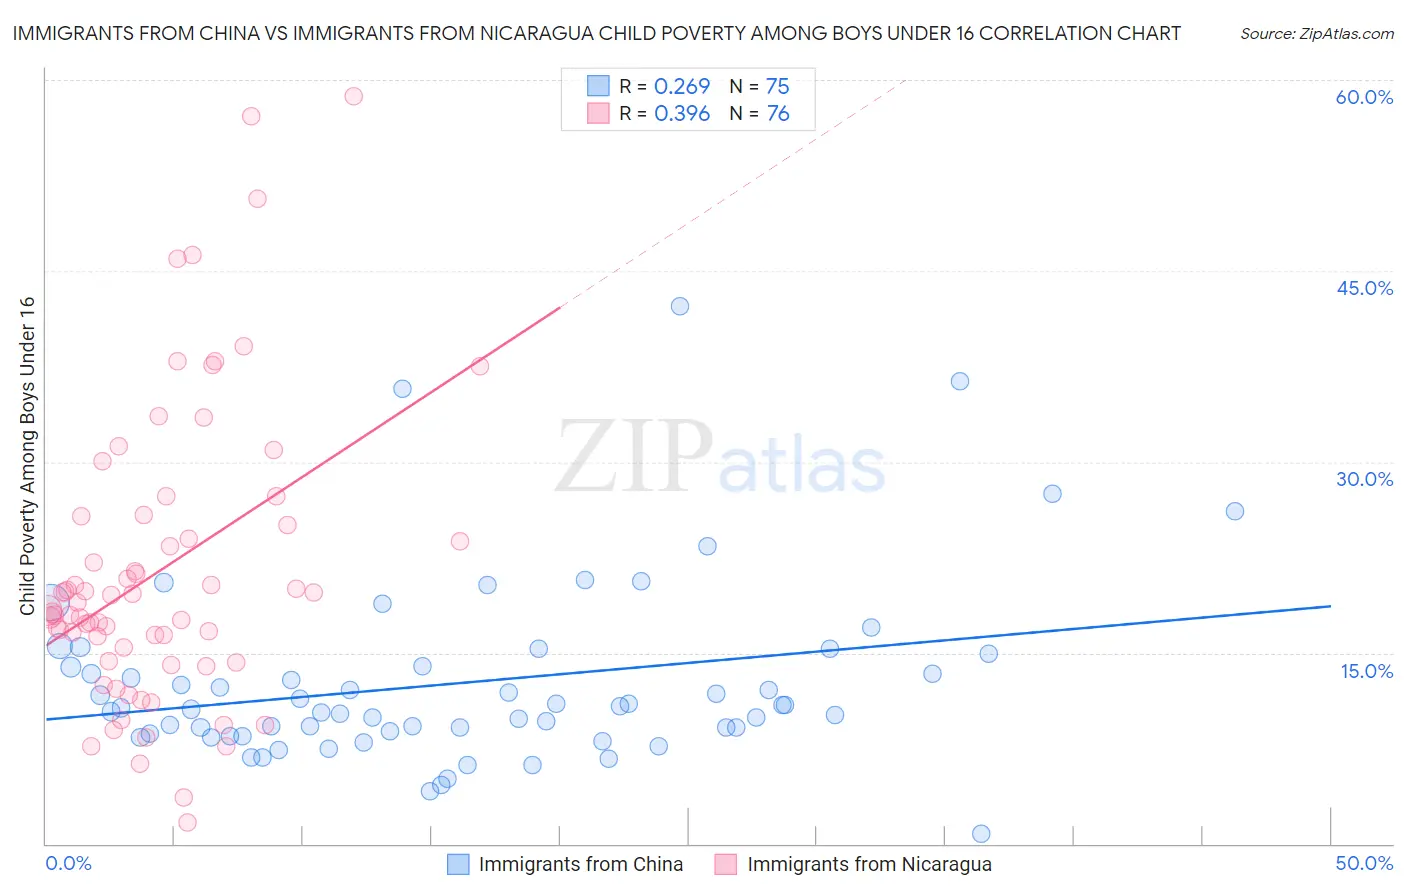
Immigrants from China vs Immigrants from Nicaragua Child Poverty Among Boys Under 16 Correlation Chart
The statistical analysis conducted on geographies consisting of 446,614,379 people shows a weak positive correlation between the proportion of Immigrants from China and poverty level among boys under the age of 16 in the United States with a correlation coefficient (R) of 0.269 and weighted average of 13.6%. Similarly, the statistical analysis conducted on geographies consisting of 235,106,184 people shows a mild positive correlation between the proportion of Immigrants from Nicaragua and poverty level among boys under the age of 16 in the United States with a correlation coefficient (R) of 0.396 and weighted average of 19.0%, a difference of 39.9%.
Child Poverty Among Boys Under 16 Correlation Summary
| Measurement | Immigrants from China | Immigrants from Nicaragua |
| Minimum | 0.83% | 1.7% |
| Maximum | 42.3% | 58.8% |
| Range | 41.4% | 57.0% |
| Mean | 12.6% | 21.4% |
| Median | 10.7% | 18.6% |
| Interquartile 25% (IQ1) | 8.6% | 14.9% |
| Interquartile 75% (IQ3) | 13.9% | 25.4% |
| Interquartile Range (IQR) | 5.3% | 10.5% |
| Standard Deviation (Sample) | 7.2% | 11.5% |
| Standard Deviation (Population) | 7.1% | 11.4% |
Similar Demographics by Child Poverty Among Boys Under 16
Demographics Similar to Immigrants from China by Child Poverty Among Boys Under 16
In terms of child poverty among boys under 16, the demographic groups most similar to Immigrants from China are Turkish (13.6%, a difference of 0.090%), Swedish (13.6%, a difference of 0.17%), Danish (13.6%, a difference of 0.18%), Cypriot (13.6%, a difference of 0.27%), and Assyrian/Chaldean/Syriac (13.6%, a difference of 0.29%).
| Demographics | Rating | Rank | Child Poverty Among Boys Under 16 |
| Okinawans | 99.8 /100 | #25 | Exceptional 13.5% |
| Immigrants | Bolivia | 99.8 /100 | #26 | Exceptional 13.5% |
| Asians | 99.8 /100 | #27 | Exceptional 13.5% |
| Eastern Europeans | 99.8 /100 | #28 | Exceptional 13.5% |
| Cypriots | 99.8 /100 | #29 | Exceptional 13.6% |
| Swedes | 99.8 /100 | #30 | Exceptional 13.6% |
| Turks | 99.8 /100 | #31 | Exceptional 13.6% |
| Immigrants | China | 99.8 /100 | #32 | Exceptional 13.6% |
| Danes | 99.8 /100 | #33 | Exceptional 13.6% |
| Assyrians/Chaldeans/Syriacs | 99.8 /100 | #34 | Exceptional 13.6% |
| Russians | 99.7 /100 | #35 | Exceptional 13.8% |
| Luxembourgers | 99.7 /100 | #36 | Exceptional 13.8% |
| Immigrants | Sri Lanka | 99.6 /100 | #37 | Exceptional 13.9% |
| Immigrants | Northern Europe | 99.6 /100 | #38 | Exceptional 13.9% |
| Immigrants | Australia | 99.6 /100 | #39 | Exceptional 13.9% |
Demographics Similar to Immigrants from Nicaragua by Child Poverty Among Boys Under 16
In terms of child poverty among boys under 16, the demographic groups most similar to Immigrants from Nicaragua are Immigrants from Trinidad and Tobago (19.0%, a difference of 0.12%), Cree (19.0%, a difference of 0.20%), Salvadoran (19.0%, a difference of 0.20%), Immigrants from Middle Africa (18.9%, a difference of 0.33%), and Immigrants from the Azores (18.9%, a difference of 0.34%).
| Demographics | Rating | Rank | Child Poverty Among Boys Under 16 |
| Cape Verdeans | 0.7 /100 | #239 | Tragic 18.7% |
| Immigrants | Cuba | 0.6 /100 | #240 | Tragic 18.8% |
| Immigrants | Sudan | 0.6 /100 | #241 | Tragic 18.8% |
| Ghanaians | 0.5 /100 | #242 | Tragic 18.9% |
| Immigrants | Azores | 0.4 /100 | #243 | Tragic 18.9% |
| Immigrants | Middle Africa | 0.4 /100 | #244 | Tragic 18.9% |
| Cree | 0.4 /100 | #245 | Tragic 19.0% |
| Immigrants | Nicaragua | 0.4 /100 | #246 | Tragic 19.0% |
| Immigrants | Trinidad and Tobago | 0.3 /100 | #247 | Tragic 19.0% |
| Salvadorans | 0.3 /100 | #248 | Tragic 19.0% |
| Alsatians | 0.3 /100 | #249 | Tragic 19.1% |
| Immigrants | Burma/Myanmar | 0.2 /100 | #250 | Tragic 19.2% |
| French American Indians | 0.2 /100 | #251 | Tragic 19.2% |
| Immigrants | Western Africa | 0.2 /100 | #252 | Tragic 19.3% |
| Liberians | 0.2 /100 | #253 | Tragic 19.3% |