Immigrants from Caribbean vs Nigerian Seniors Poverty Over the Age of 75
COMPARE
Immigrants from Caribbean
Nigerian
Seniors Poverty Over the Age of 75
Seniors Poverty Over the Age of 75 Comparison
Immigrants from Caribbean
Nigerians
18.2%
SENIORS POVERTY OVER THE AGE OF 75
0.0/ 100
METRIC RATING
336th/ 347
METRIC RANK
13.0%
SENIORS POVERTY OVER THE AGE OF 75
3.4/ 100
METRIC RATING
222nd/ 347
METRIC RANK
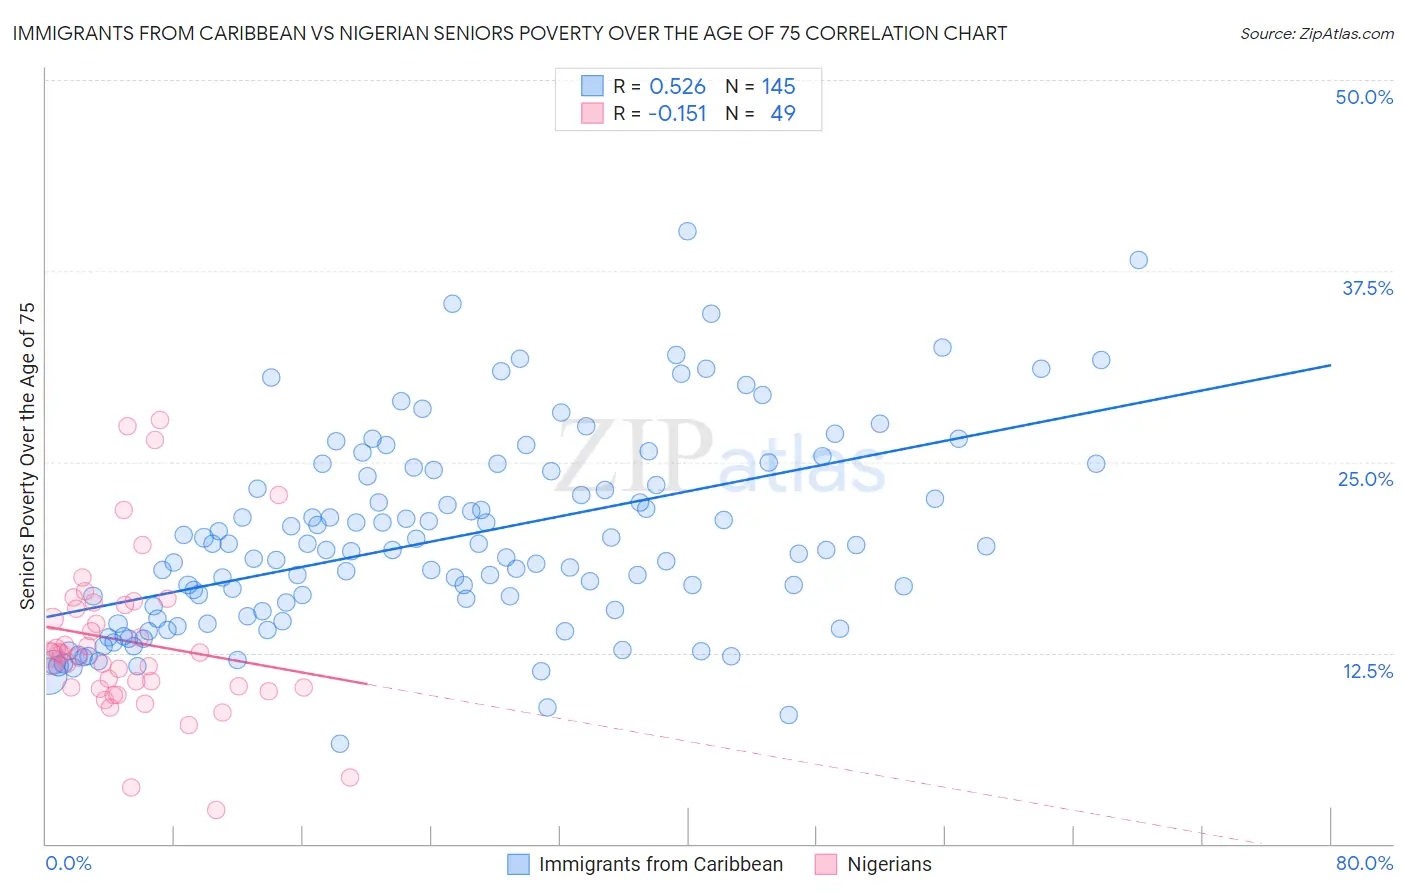
Immigrants from Caribbean vs Nigerian Seniors Poverty Over the Age of 75 Correlation Chart
The statistical analysis conducted on geographies consisting of 443,355,794 people shows a substantial positive correlation between the proportion of Immigrants from Caribbean and poverty level among seniors over the age of 75 in the United States with a correlation coefficient (R) of 0.526 and weighted average of 18.2%. Similarly, the statistical analysis conducted on geographies consisting of 329,712,817 people shows a poor negative correlation between the proportion of Nigerians and poverty level among seniors over the age of 75 in the United States with a correlation coefficient (R) of -0.151 and weighted average of 13.0%, a difference of 40.2%.
Seniors Poverty Over the Age of 75 Correlation Summary
| Measurement | Immigrants from Caribbean | Nigerian |
| Minimum | 6.6% | 2.2% |
| Maximum | 40.1% | 27.8% |
| Range | 33.5% | 25.6% |
| Mean | 19.9% | 13.2% |
| Median | 19.2% | 12.3% |
| Interquartile 25% (IQ1) | 14.8% | 10.2% |
| Interquartile 75% (IQ3) | 24.2% | 15.7% |
| Interquartile Range (IQR) | 9.4% | 5.5% |
| Standard Deviation (Sample) | 6.4% | 5.3% |
| Standard Deviation (Population) | 6.4% | 5.3% |
Similar Demographics by Seniors Poverty Over the Age of 75
Demographics Similar to Immigrants from Caribbean by Seniors Poverty Over the Age of 75
In terms of seniors poverty over the age of 75, the demographic groups most similar to Immigrants from Caribbean are Yakama (18.3%, a difference of 0.40%), Immigrants from Cabo Verde (18.5%, a difference of 1.4%), Cuban (18.0%, a difference of 1.6%), Immigrants from Grenada (17.8%, a difference of 2.2%), and Hopi (18.9%, a difference of 3.4%).
| Demographics | Rating | Rank | Seniors Poverty Over the Age of 75 |
| Immigrants | Dominica | 0.0 /100 | #329 | Tragic 17.0% |
| British West Indians | 0.0 /100 | #330 | Tragic 17.4% |
| Immigrants | Armenia | 0.0 /100 | #331 | Tragic 17.5% |
| Immigrants | St. Vincent and the Grenadines | 0.0 /100 | #332 | Tragic 17.5% |
| Immigrants | Nicaragua | 0.0 /100 | #333 | Tragic 17.6% |
| Immigrants | Grenada | 0.0 /100 | #334 | Tragic 17.8% |
| Cubans | 0.0 /100 | #335 | Tragic 18.0% |
| Immigrants | Caribbean | 0.0 /100 | #336 | Tragic 18.2% |
| Yakama | 0.0 /100 | #337 | Tragic 18.3% |
| Immigrants | Cabo Verde | 0.0 /100 | #338 | Tragic 18.5% |
| Hopi | 0.0 /100 | #339 | Tragic 18.9% |
| Tohono O'odham | 0.0 /100 | #340 | Tragic 19.1% |
| Navajo | 0.0 /100 | #341 | Tragic 19.4% |
| Dominicans | 0.0 /100 | #342 | Tragic 19.6% |
| Lumbee | 0.0 /100 | #343 | Tragic 19.7% |
Demographics Similar to Nigerians by Seniors Poverty Over the Age of 75
In terms of seniors poverty over the age of 75, the demographic groups most similar to Nigerians are Immigrants from Nigeria (13.0%, a difference of 0.090%), Chippewa (13.1%, a difference of 0.29%), Immigrants from Morocco (13.1%, a difference of 0.36%), Immigrants from Kazakhstan (13.0%, a difference of 0.44%), and Shoshone (13.1%, a difference of 0.52%).
| Demographics | Rating | Rank | Seniors Poverty Over the Age of 75 |
| South American Indians | 5.5 /100 | #215 | Tragic 12.9% |
| Immigrants | Brazil | 5.2 /100 | #216 | Tragic 12.9% |
| Bermudans | 4.9 /100 | #217 | Tragic 12.9% |
| Immigrants | Western Asia | 4.9 /100 | #218 | Tragic 12.9% |
| Ute | 4.7 /100 | #219 | Tragic 12.9% |
| Seminole | 4.5 /100 | #220 | Tragic 12.9% |
| Immigrants | Kazakhstan | 4.3 /100 | #221 | Tragic 13.0% |
| Nigerians | 3.4 /100 | #222 | Tragic 13.0% |
| Immigrants | Nigeria | 3.3 /100 | #223 | Tragic 13.0% |
| Chippewa | 2.9 /100 | #224 | Tragic 13.1% |
| Immigrants | Morocco | 2.8 /100 | #225 | Tragic 13.1% |
| Shoshone | 2.6 /100 | #226 | Tragic 13.1% |
| Cree | 2.3 /100 | #227 | Tragic 13.1% |
| Israelis | 2.0 /100 | #228 | Tragic 13.2% |
| Somalis | 1.6 /100 | #229 | Tragic 13.2% |