Immigrants from Caribbean vs Immigrants from Cuba Female Poverty Among 18-24 Year Olds
COMPARE
Immigrants from Caribbean
Immigrants from Cuba
Female Poverty Among 18-24 Year Olds
Female Poverty Among 18-24 Year Olds Comparison
Immigrants from Caribbean
Immigrants from Cuba
19.1%
FEMALE POVERTY AMONG 18-24 YEAR OLDS
98.1/ 100
METRIC RATING
102nd/ 347
METRIC RANK
16.4%
FEMALE POVERTY AMONG 18-24 YEAR OLDS
100.0/ 100
METRIC RATING
3rd/ 347
METRIC RANK
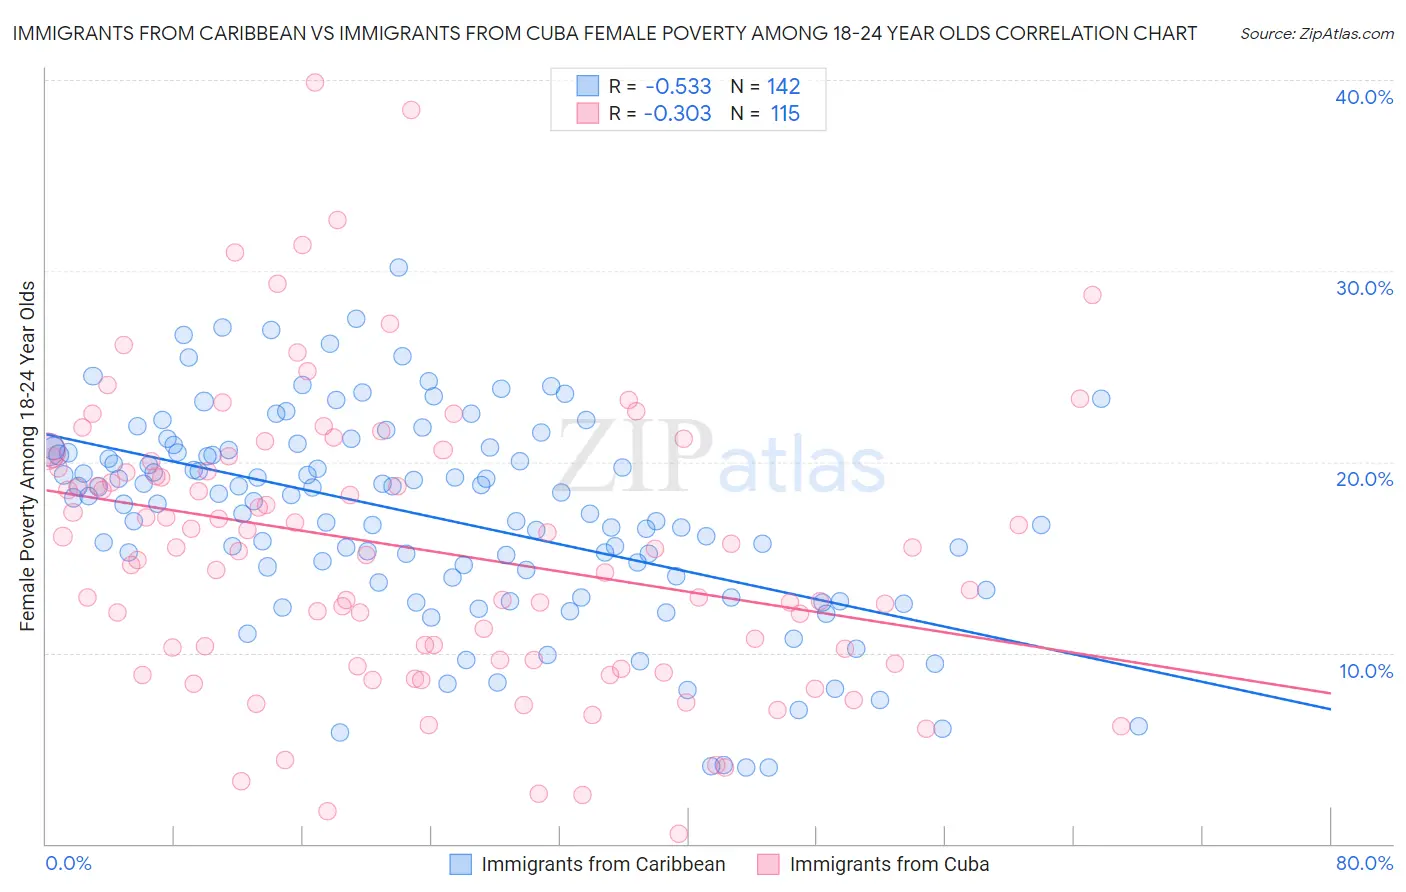
Immigrants from Caribbean vs Immigrants from Cuba Female Poverty Among 18-24 Year Olds Correlation Chart
The statistical analysis conducted on geographies consisting of 436,067,401 people shows a substantial negative correlation between the proportion of Immigrants from Caribbean and poverty level among females between the ages 18 and 24 in the United States with a correlation coefficient (R) of -0.533 and weighted average of 19.1%. Similarly, the statistical analysis conducted on geographies consisting of 319,027,891 people shows a mild negative correlation between the proportion of Immigrants from Cuba and poverty level among females between the ages 18 and 24 in the United States with a correlation coefficient (R) of -0.303 and weighted average of 16.4%, a difference of 16.5%.
Female Poverty Among 18-24 Year Olds Correlation Summary
| Measurement | Immigrants from Caribbean | Immigrants from Cuba |
| Minimum | 4.0% | 0.55% |
| Maximum | 30.2% | 39.9% |
| Range | 26.2% | 39.3% |
| Mean | 17.1% | 15.5% |
| Median | 18.0% | 15.5% |
| Interquartile 25% (IQ1) | 13.9% | 9.6% |
| Interquartile 75% (IQ3) | 20.6% | 20.0% |
| Interquartile Range (IQR) | 6.7% | 10.4% |
| Standard Deviation (Sample) | 5.4% | 7.5% |
| Standard Deviation (Population) | 5.4% | 7.5% |
Similar Demographics by Female Poverty Among 18-24 Year Olds
Demographics Similar to Immigrants from Caribbean by Female Poverty Among 18-24 Year Olds
In terms of female poverty among 18-24 year olds, the demographic groups most similar to Immigrants from Caribbean are Ecuadorian (19.1%, a difference of 0.020%), Serbian (19.1%, a difference of 0.040%), Immigrants from Afghanistan (19.1%, a difference of 0.080%), Chilean (19.1%, a difference of 0.11%), and Immigrants from Czechoslovakia (19.1%, a difference of 0.13%).
| Demographics | Rating | Rank | Female Poverty Among 18-24 Year Olds |
| Guamanians/Chamorros | 98.8 /100 | #95 | Exceptional 19.0% |
| Sierra Leoneans | 98.7 /100 | #96 | Exceptional 19.0% |
| Salvadorans | 98.4 /100 | #97 | Exceptional 19.1% |
| Immigrants | Jordan | 98.4 /100 | #98 | Exceptional 19.1% |
| Immigrants | Czechoslovakia | 98.3 /100 | #99 | Exceptional 19.1% |
| Chileans | 98.3 /100 | #100 | Exceptional 19.1% |
| Ecuadorians | 98.1 /100 | #101 | Exceptional 19.1% |
| Immigrants | Caribbean | 98.1 /100 | #102 | Exceptional 19.1% |
| Serbians | 98.0 /100 | #103 | Exceptional 19.1% |
| Immigrants | Afghanistan | 98.0 /100 | #104 | Exceptional 19.1% |
| Immigrants | Ecuador | 97.8 /100 | #105 | Exceptional 19.2% |
| Immigrants | Sierra Leone | 97.8 /100 | #106 | Exceptional 19.2% |
| Immigrants | Sri Lanka | 97.5 /100 | #107 | Exceptional 19.2% |
| Immigrants | Uzbekistan | 97.3 /100 | #108 | Exceptional 19.2% |
| Immigrants | Syria | 97.2 /100 | #109 | Exceptional 19.2% |
Demographics Similar to Immigrants from Cuba by Female Poverty Among 18-24 Year Olds
In terms of female poverty among 18-24 year olds, the demographic groups most similar to Immigrants from Cuba are Immigrants from India (16.4%, a difference of 0.030%), Immigrants from Portugal (16.5%, a difference of 0.75%), Immigrants from Philippines (16.7%, a difference of 1.5%), Immigrants from the Azores (16.7%, a difference of 1.6%), and Chinese (16.2%, a difference of 1.7%).
| Demographics | Rating | Rank | Female Poverty Among 18-24 Year Olds |
| Assyrians/Chaldeans/Syriacs | 100.0 /100 | #1 | Exceptional 13.7% |
| Chinese | 100.0 /100 | #2 | Exceptional 16.2% |
| Immigrants | Cuba | 100.0 /100 | #3 | Exceptional 16.4% |
| Immigrants | India | 100.0 /100 | #4 | Exceptional 16.4% |
| Immigrants | Portugal | 100.0 /100 | #5 | Exceptional 16.5% |
| Immigrants | Philippines | 100.0 /100 | #6 | Exceptional 16.7% |
| Immigrants | Azores | 100.0 /100 | #7 | Exceptional 16.7% |
| Immigrants | Bolivia | 100.0 /100 | #8 | Exceptional 16.7% |
| Immigrants | Peru | 100.0 /100 | #9 | Exceptional 16.9% |
| Koreans | 100.0 /100 | #10 | Exceptional 16.9% |
| Thais | 100.0 /100 | #11 | Exceptional 17.0% |
| Immigrants | Pakistan | 100.0 /100 | #12 | Exceptional 17.0% |
| Immigrants | Poland | 100.0 /100 | #13 | Exceptional 17.1% |
| Tongans | 100.0 /100 | #14 | Exceptional 17.1% |
| Cubans | 100.0 /100 | #15 | Exceptional 17.2% |