Immigrants from Canada vs Immigrants from Sri Lanka Receiving Food Stamps
COMPARE
Immigrants from Canada
Immigrants from Sri Lanka
Receiving Food Stamps
Receiving Food Stamps Comparison
Immigrants from Canada
Immigrants from Sri Lanka
9.7%
RECEIVING FOOD STAMPS
99.3/ 100
METRIC RATING
56th/ 347
METRIC RANK
9.5%
RECEIVING FOOD STAMPS
99.5/ 100
METRIC RATING
38th/ 347
METRIC RANK
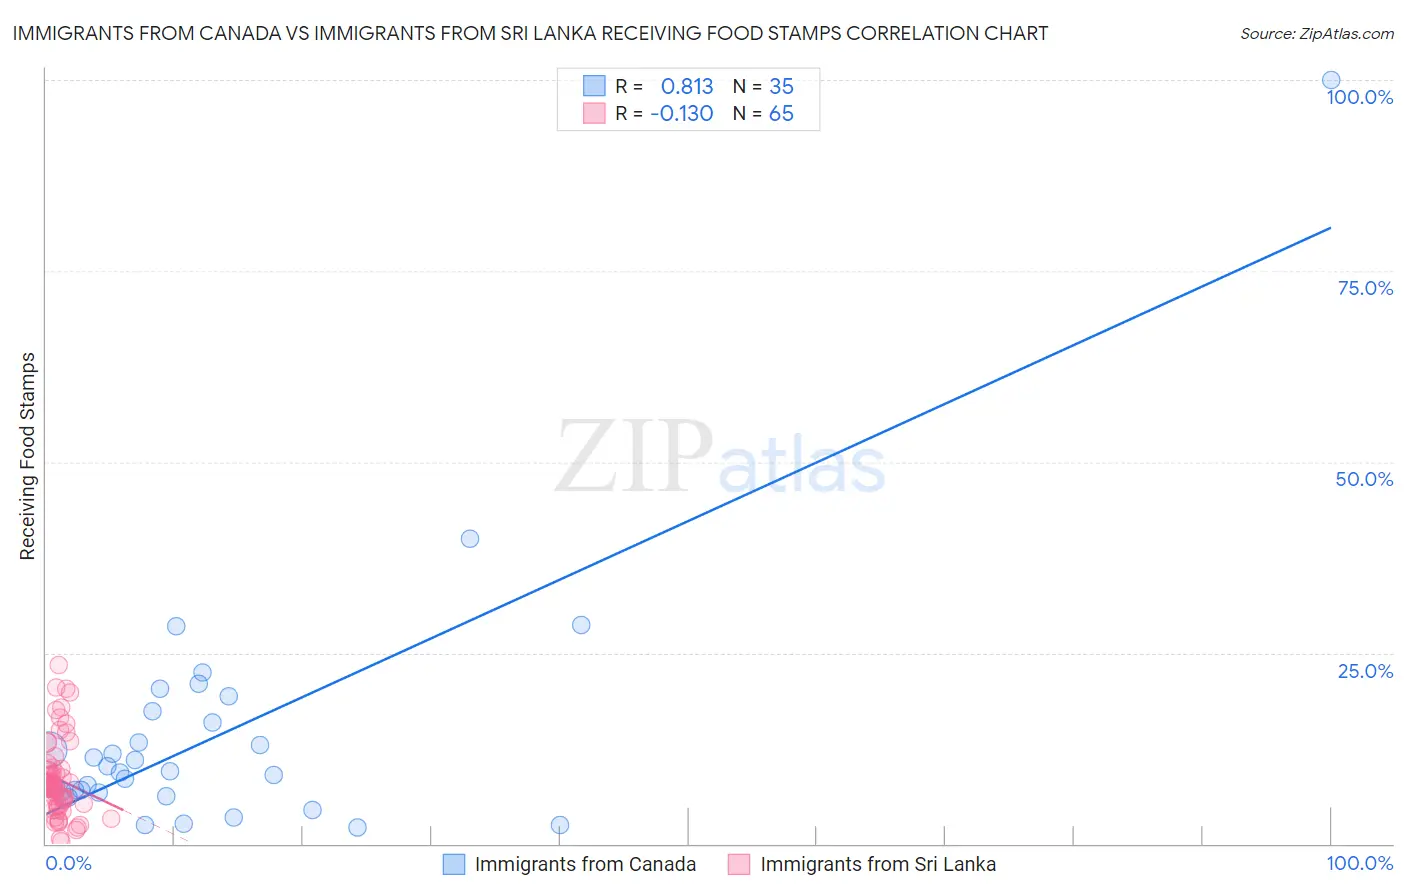
Immigrants from Canada vs Immigrants from Sri Lanka Receiving Food Stamps Correlation Chart
The statistical analysis conducted on geographies consisting of 457,609,455 people shows a very strong positive correlation between the proportion of Immigrants from Canada and percentage of population receiving government assistance and/or food stamps in the United States with a correlation coefficient (R) of 0.813 and weighted average of 9.7%. Similarly, the statistical analysis conducted on geographies consisting of 149,559,028 people shows a poor negative correlation between the proportion of Immigrants from Sri Lanka and percentage of population receiving government assistance and/or food stamps in the United States with a correlation coefficient (R) of -0.130 and weighted average of 9.5%, a difference of 2.1%.
Receiving Food Stamps Correlation Summary
| Measurement | Immigrants from Canada | Immigrants from Sri Lanka |
| Minimum | 2.1% | 0.30% |
| Maximum | 100.0% | 23.4% |
| Range | 97.9% | 23.1% |
| Mean | 14.4% | 8.5% |
| Median | 9.6% | 7.4% |
| Interquartile 25% (IQ1) | 6.7% | 5.1% |
| Interquartile 75% (IQ3) | 17.4% | 9.9% |
| Interquartile Range (IQR) | 10.7% | 4.8% |
| Standard Deviation (Sample) | 17.1% | 5.1% |
| Standard Deviation (Population) | 16.9% | 5.1% |
Demographics Similar to Immigrants from Canada and Immigrants from Sri Lanka by Receiving Food Stamps
In terms of receiving food stamps, the demographic groups most similar to Immigrants from Canada are Greek (9.7%, a difference of 0.11%), Immigrants from Switzerland (9.7%, a difference of 0.18%), Swiss (9.7%, a difference of 0.19%), Tongan (9.7%, a difference of 0.31%), and Immigrants from South Africa (9.7%, a difference of 0.33%). Similarly, the demographic groups most similar to Immigrants from Sri Lanka are Immigrants from Bolivia (9.5%, a difference of 0.010%), Immigrants from Netherlands (9.5%, a difference of 0.020%), Cambodian (9.5%, a difference of 0.19%), European (9.5%, a difference of 0.29%), and Immigrants from China (9.6%, a difference of 0.44%).
| Demographics | Rating | Rank | Receiving Food Stamps |
| Europeans | 99.6 /100 | #37 | Exceptional 9.5% |
| Immigrants | Sri Lanka | 99.5 /100 | #38 | Exceptional 9.5% |
| Immigrants | Bolivia | 99.5 /100 | #39 | Exceptional 9.5% |
| Immigrants | Netherlands | 99.5 /100 | #40 | Exceptional 9.5% |
| Cambodians | 99.5 /100 | #41 | Exceptional 9.5% |
| Immigrants | China | 99.5 /100 | #42 | Exceptional 9.6% |
| Croatians | 99.5 /100 | #43 | Exceptional 9.6% |
| Immigrants | Denmark | 99.4 /100 | #44 | Exceptional 9.6% |
| Immigrants | Belgium | 99.4 /100 | #45 | Exceptional 9.6% |
| Australians | 99.4 /100 | #46 | Exceptional 9.6% |
| Indians (Asian) | 99.4 /100 | #47 | Exceptional 9.6% |
| Russians | 99.4 /100 | #48 | Exceptional 9.6% |
| Immigrants | Czechoslovakia | 99.4 /100 | #49 | Exceptional 9.6% |
| Lithuanians | 99.4 /100 | #50 | Exceptional 9.7% |
| Asians | 99.3 /100 | #51 | Exceptional 9.7% |
| Immigrants | South Africa | 99.3 /100 | #52 | Exceptional 9.7% |
| Tongans | 99.3 /100 | #53 | Exceptional 9.7% |
| Swiss | 99.3 /100 | #54 | Exceptional 9.7% |
| Immigrants | Switzerland | 99.3 /100 | #55 | Exceptional 9.7% |
| Immigrants | Canada | 99.3 /100 | #56 | Exceptional 9.7% |
| Greeks | 99.3 /100 | #57 | Exceptional 9.7% |