Immigrants from Canada vs Immigrants from Kazakhstan Child Poverty Under the Age of 16
COMPARE
Immigrants from Canada
Immigrants from Kazakhstan
Child Poverty Under the Age of 16
Child Poverty Under the Age of 16 Comparison
Immigrants from Canada
Immigrants from Kazakhstan
14.5%
CHILD POVERTY UNDER THE AGE OF 16
97.2/ 100
METRIC RATING
82nd/ 347
METRIC RANK
15.1%
CHILD POVERTY UNDER THE AGE OF 16
90.2/ 100
METRIC RATING
128th/ 347
METRIC RANK
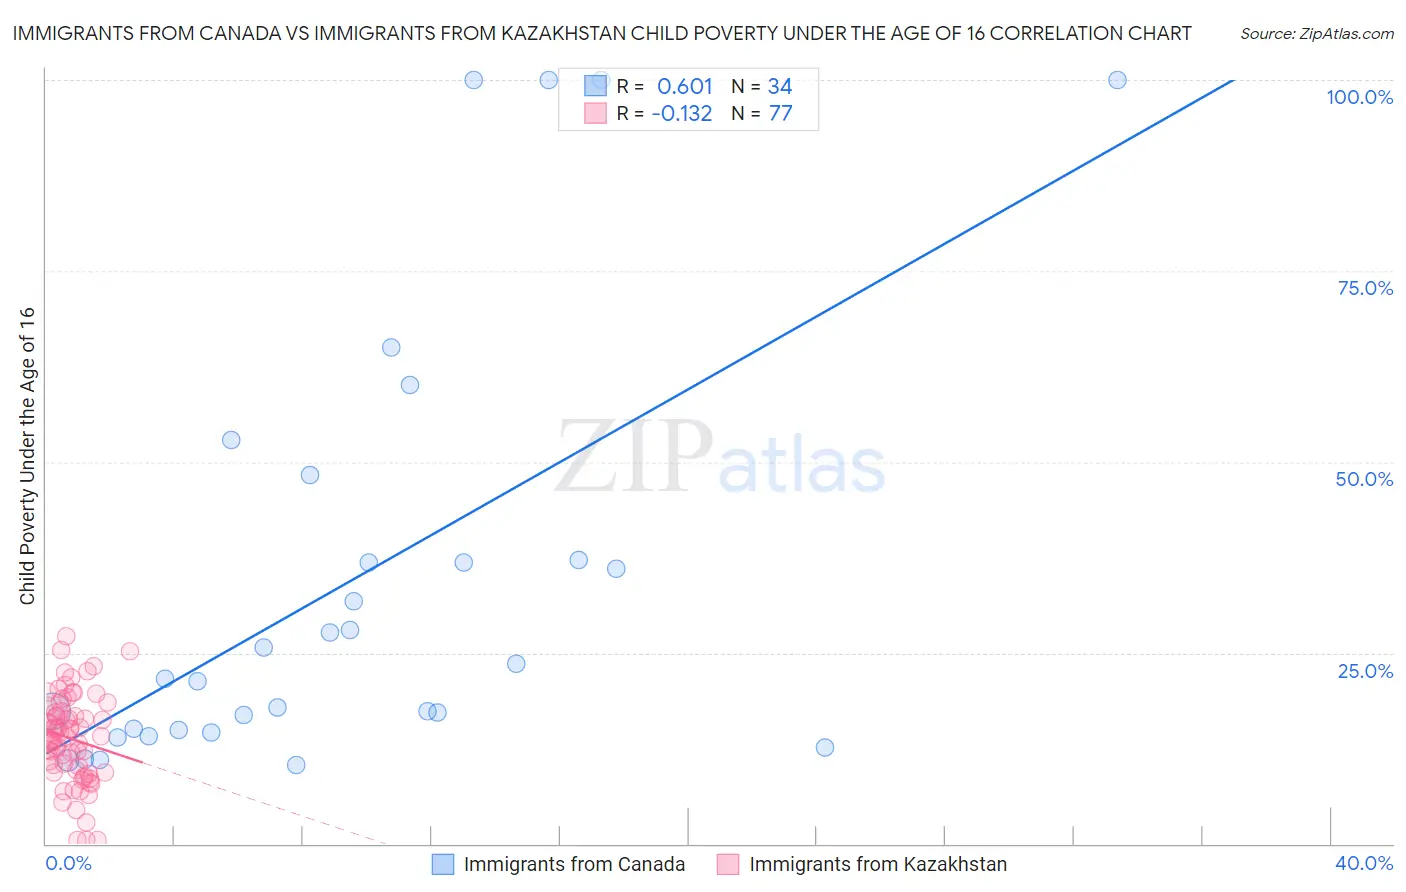
Immigrants from Canada vs Immigrants from Kazakhstan Child Poverty Under the Age of 16 Correlation Chart
The statistical analysis conducted on geographies consisting of 452,889,147 people shows a significant positive correlation between the proportion of Immigrants from Canada and poverty level among children under the age of 16 in the United States with a correlation coefficient (R) of 0.601 and weighted average of 14.5%. Similarly, the statistical analysis conducted on geographies consisting of 123,992,242 people shows a poor negative correlation between the proportion of Immigrants from Kazakhstan and poverty level among children under the age of 16 in the United States with a correlation coefficient (R) of -0.132 and weighted average of 15.1%, a difference of 4.4%.
Child Poverty Under the Age of 16 Correlation Summary
| Measurement | Immigrants from Canada | Immigrants from Kazakhstan |
| Minimum | 10.3% | 0.43% |
| Maximum | 100.0% | 27.1% |
| Range | 89.7% | 26.7% |
| Mean | 34.3% | 13.8% |
| Median | 22.6% | 13.9% |
| Interquartile 25% (IQ1) | 14.9% | 9.5% |
| Interquartile 75% (IQ3) | 37.1% | 17.3% |
| Interquartile Range (IQR) | 22.2% | 7.8% |
| Standard Deviation (Sample) | 28.1% | 5.8% |
| Standard Deviation (Population) | 27.7% | 5.7% |
Similar Demographics by Child Poverty Under the Age of 16
Demographics Similar to Immigrants from Canada by Child Poverty Under the Age of 16
In terms of child poverty under the age of 16, the demographic groups most similar to Immigrants from Canada are Finnish (14.5%, a difference of 0.030%), Egyptian (14.5%, a difference of 0.030%), Immigrants from Latvia (14.5%, a difference of 0.050%), Immigrants from North Macedonia (14.5%, a difference of 0.060%), and Soviet Union (14.5%, a difference of 0.070%).
| Demographics | Rating | Rank | Child Poverty Under the Age of 16 |
| Ukrainians | 97.5 /100 | #75 | Exceptional 14.4% |
| Immigrants | Eastern Europe | 97.5 /100 | #76 | Exceptional 14.4% |
| Australians | 97.5 /100 | #77 | Exceptional 14.4% |
| Immigrants | Russia | 97.3 /100 | #78 | Exceptional 14.5% |
| Swiss | 97.3 /100 | #79 | Exceptional 14.5% |
| Immigrants | North Macedonia | 97.2 /100 | #80 | Exceptional 14.5% |
| Finns | 97.2 /100 | #81 | Exceptional 14.5% |
| Immigrants | Canada | 97.2 /100 | #82 | Exceptional 14.5% |
| Egyptians | 97.2 /100 | #83 | Exceptional 14.5% |
| Immigrants | Latvia | 97.1 /100 | #84 | Exceptional 14.5% |
| Soviet Union | 97.1 /100 | #85 | Exceptional 14.5% |
| Immigrants | Argentina | 97.1 /100 | #86 | Exceptional 14.5% |
| Taiwanese | 97.1 /100 | #87 | Exceptional 14.5% |
| Northern Europeans | 97.0 /100 | #88 | Exceptional 14.5% |
| Germans | 96.9 /100 | #89 | Exceptional 14.5% |
Demographics Similar to Immigrants from Kazakhstan by Child Poverty Under the Age of 16
In terms of child poverty under the age of 16, the demographic groups most similar to Immigrants from Kazakhstan are Immigrants from Western Europe (15.1%, a difference of 0.060%), Portuguese (15.1%, a difference of 0.15%), Immigrants from Southern Europe (15.1%, a difference of 0.15%), Mongolian (15.2%, a difference of 0.25%), and Armenian (15.2%, a difference of 0.28%).
| Demographics | Rating | Rank | Child Poverty Under the Age of 16 |
| Immigrants | Zimbabwe | 92.1 /100 | #121 | Exceptional 15.0% |
| Pakistanis | 91.7 /100 | #122 | Exceptional 15.0% |
| Immigrants | Brazil | 91.1 /100 | #123 | Exceptional 15.1% |
| Czechoslovakians | 91.0 /100 | #124 | Exceptional 15.1% |
| Palestinians | 90.9 /100 | #125 | Exceptional 15.1% |
| Portuguese | 90.6 /100 | #126 | Exceptional 15.1% |
| Immigrants | Western Europe | 90.3 /100 | #127 | Exceptional 15.1% |
| Immigrants | Kazakhstan | 90.2 /100 | #128 | Exceptional 15.1% |
| Immigrants | Southern Europe | 89.7 /100 | #129 | Excellent 15.1% |
| Mongolians | 89.5 /100 | #130 | Excellent 15.2% |
| Armenians | 89.4 /100 | #131 | Excellent 15.2% |
| Canadians | 89.1 /100 | #132 | Excellent 15.2% |
| Immigrants | South Eastern Asia | 89.0 /100 | #133 | Excellent 15.2% |
| Native Hawaiians | 88.7 /100 | #134 | Excellent 15.2% |
| Albanians | 88.6 /100 | #135 | Excellent 15.2% |