Immigrants from Cameroon vs Nicaraguan Single Father Poverty
COMPARE
Immigrants from Cameroon
Nicaraguan
Single Father Poverty
Single Father Poverty Comparison
Immigrants from Cameroon
Nicaraguans
15.2%
SINGLE FATHER POVERTY
99.7/ 100
METRIC RATING
68th/ 347
METRIC RANK
15.9%
SINGLE FATHER POVERTY
90.1/ 100
METRIC RATING
131st/ 347
METRIC RANK
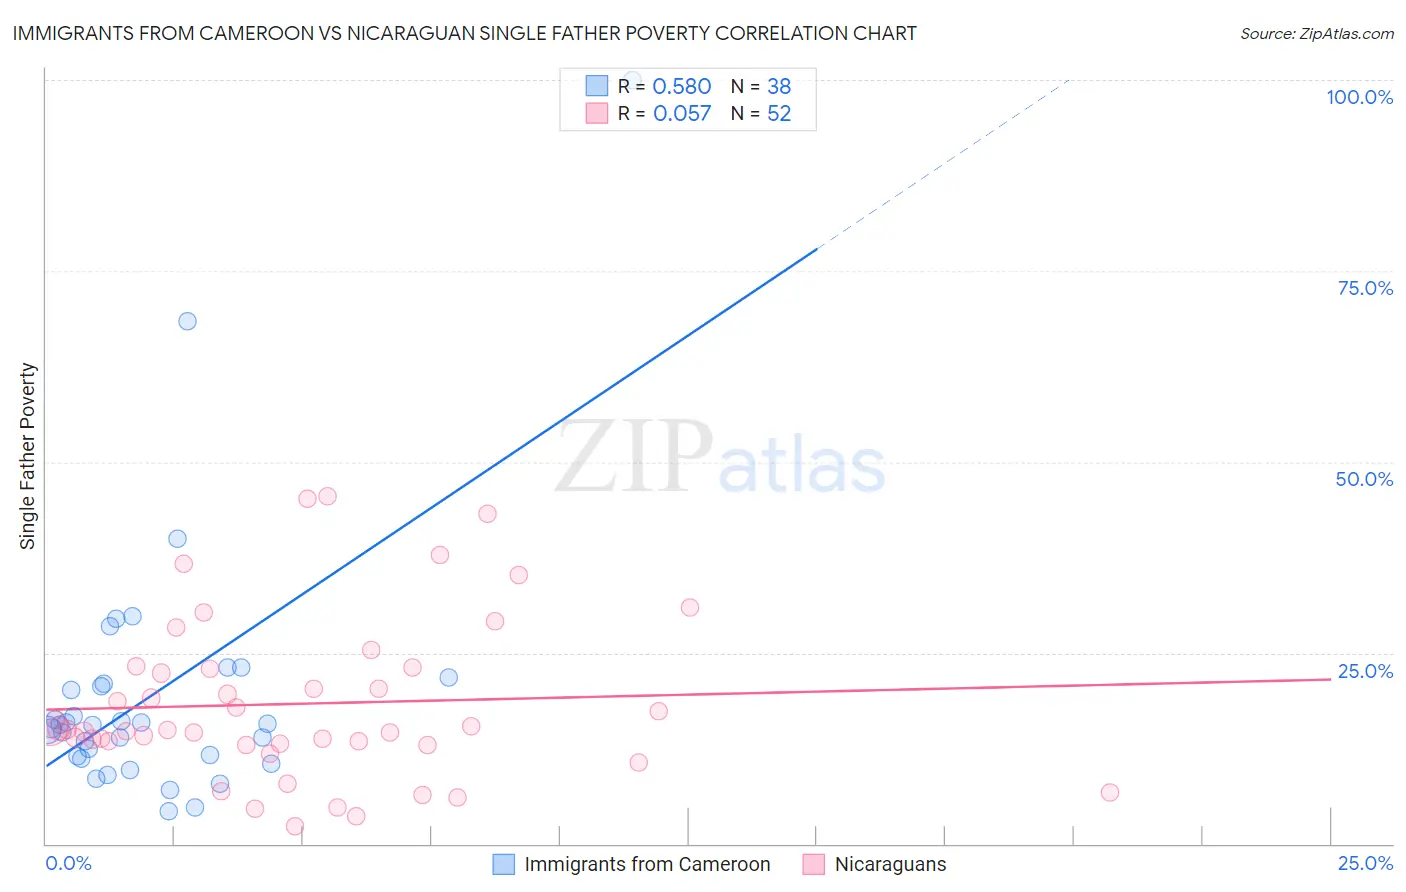
Immigrants from Cameroon vs Nicaraguan Single Father Poverty Correlation Chart
The statistical analysis conducted on geographies consisting of 118,461,150 people shows a substantial positive correlation between the proportion of Immigrants from Cameroon and poverty level among single fathers in the United States with a correlation coefficient (R) of 0.580 and weighted average of 15.2%. Similarly, the statistical analysis conducted on geographies consisting of 241,925,601 people shows a slight positive correlation between the proportion of Nicaraguans and poverty level among single fathers in the United States with a correlation coefficient (R) of 0.057 and weighted average of 15.9%, a difference of 4.4%.
Single Father Poverty Correlation Summary
| Measurement | Immigrants from Cameroon | Nicaraguan |
| Minimum | 4.2% | 2.2% |
| Maximum | 100.0% | 45.5% |
| Range | 95.8% | 43.2% |
| Mean | 19.7% | 18.3% |
| Median | 15.6% | 15.0% |
| Interquartile 25% (IQ1) | 11.5% | 13.1% |
| Interquartile 75% (IQ3) | 20.9% | 23.0% |
| Interquartile Range (IQR) | 9.4% | 9.9% |
| Standard Deviation (Sample) | 17.5% | 10.6% |
| Standard Deviation (Population) | 17.2% | 10.5% |
Similar Demographics by Single Father Poverty
Demographics Similar to Immigrants from Cameroon by Single Father Poverty
In terms of single father poverty, the demographic groups most similar to Immigrants from Cameroon are Japanese (15.2%, a difference of 0.030%), Paraguayan (15.2%, a difference of 0.090%), Mongolian (15.3%, a difference of 0.13%), Immigrants from Moldova (15.2%, a difference of 0.18%), and Immigrants from Malaysia (15.2%, a difference of 0.20%).
| Demographics | Rating | Rank | Single Father Poverty |
| Immigrants | Bosnia and Herzegovina | 99.8 /100 | #61 | Exceptional 15.2% |
| Immigrants | Armenia | 99.8 /100 | #62 | Exceptional 15.2% |
| Immigrants | Sweden | 99.8 /100 | #63 | Exceptional 15.2% |
| Bangladeshis | 99.8 /100 | #64 | Exceptional 15.2% |
| Immigrants | Malaysia | 99.8 /100 | #65 | Exceptional 15.2% |
| Immigrants | Moldova | 99.8 /100 | #66 | Exceptional 15.2% |
| Paraguayans | 99.7 /100 | #67 | Exceptional 15.2% |
| Immigrants | Cameroon | 99.7 /100 | #68 | Exceptional 15.2% |
| Japanese | 99.7 /100 | #69 | Exceptional 15.2% |
| Mongolians | 99.7 /100 | #70 | Exceptional 15.3% |
| Immigrants | Brazil | 99.6 /100 | #71 | Exceptional 15.3% |
| Immigrants | Lithuania | 99.6 /100 | #72 | Exceptional 15.3% |
| Kenyans | 99.6 /100 | #73 | Exceptional 15.3% |
| Maltese | 99.6 /100 | #74 | Exceptional 15.3% |
| Immigrants | Turkey | 99.5 /100 | #75 | Exceptional 15.3% |
Demographics Similar to Nicaraguans by Single Father Poverty
In terms of single father poverty, the demographic groups most similar to Nicaraguans are Norwegian (15.9%, a difference of 0.0%), Immigrants from Portugal (15.9%, a difference of 0.060%), Immigrants from Syria (15.9%, a difference of 0.070%), Immigrants from West Indies (15.9%, a difference of 0.080%), and Immigrants from Nigeria (15.9%, a difference of 0.090%).
| Demographics | Rating | Rank | Single Father Poverty |
| Immigrants | Panama | 91.3 /100 | #124 | Exceptional 15.9% |
| Iraqis | 91.2 /100 | #125 | Exceptional 15.9% |
| Hmong | 91.1 /100 | #126 | Exceptional 15.9% |
| Immigrants | Liberia | 91.1 /100 | #127 | Exceptional 15.9% |
| Immigrants | Nigeria | 90.8 /100 | #128 | Exceptional 15.9% |
| Immigrants | West Indies | 90.8 /100 | #129 | Exceptional 15.9% |
| Norwegians | 90.2 /100 | #130 | Exceptional 15.9% |
| Nicaraguans | 90.1 /100 | #131 | Exceptional 15.9% |
| Immigrants | Portugal | 89.7 /100 | #132 | Excellent 15.9% |
| Immigrants | Syria | 89.5 /100 | #133 | Excellent 15.9% |
| Immigrants | South America | 88.5 /100 | #134 | Excellent 15.9% |
| Immigrants | Sri Lanka | 88.2 /100 | #135 | Excellent 15.9% |
| Cypriots | 87.5 /100 | #136 | Excellent 15.9% |
| Immigrants | Azores | 87.2 /100 | #137 | Excellent 15.9% |
| Central Americans | 87.1 /100 | #138 | Excellent 16.0% |