Immigrants from Cameroon vs Macedonian Family Poverty
COMPARE
Immigrants from Cameroon
Macedonian
Family Poverty
Family Poverty Comparison
Immigrants from Cameroon
Macedonians
9.0%
FAMILY POVERTY
47.1/ 100
METRIC RATING
178th/ 347
METRIC RANK
7.8%
FAMILY POVERTY
98.6/ 100
METRIC RATING
62nd/ 347
METRIC RANK
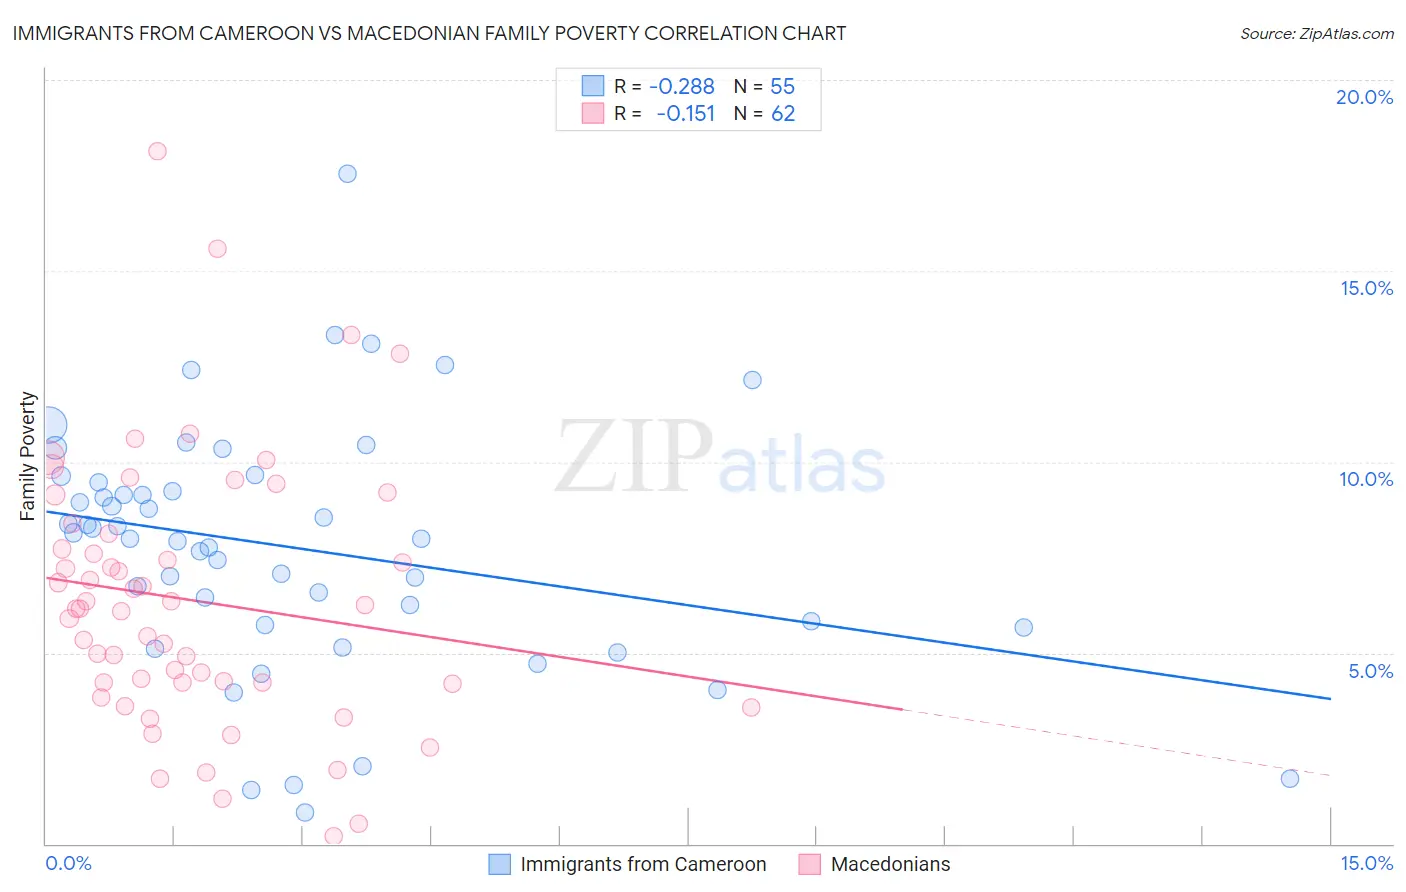
Immigrants from Cameroon vs Macedonian Family Poverty Correlation Chart
The statistical analysis conducted on geographies consisting of 130,510,031 people shows a weak negative correlation between the proportion of Immigrants from Cameroon and poverty level among families in the United States with a correlation coefficient (R) of -0.288 and weighted average of 9.0%. Similarly, the statistical analysis conducted on geographies consisting of 132,470,944 people shows a poor negative correlation between the proportion of Macedonians and poverty level among families in the United States with a correlation coefficient (R) of -0.151 and weighted average of 7.8%, a difference of 16.5%.
Family Poverty Correlation Summary
| Measurement | Immigrants from Cameroon | Macedonian |
| Minimum | 0.83% | 0.19% |
| Maximum | 17.5% | 18.1% |
| Range | 16.7% | 17.9% |
| Mean | 7.8% | 6.4% |
| Median | 8.0% | 6.2% |
| Interquartile 25% (IQ1) | 5.7% | 4.2% |
| Interquartile 75% (IQ3) | 9.5% | 8.1% |
| Interquartile Range (IQR) | 3.7% | 3.9% |
| Standard Deviation (Sample) | 3.2% | 3.5% |
| Standard Deviation (Population) | 3.2% | 3.4% |
Similar Demographics by Family Poverty
Demographics Similar to Immigrants from Cameroon by Family Poverty
In terms of family poverty, the demographic groups most similar to Immigrants from Cameroon are Hawaiian (9.0%, a difference of 0.010%), Immigrants from Syria (9.0%, a difference of 0.040%), Costa Rican (9.0%, a difference of 0.28%), Immigrants from Iraq (9.1%, a difference of 0.36%), and Immigrants from Albania (9.0%, a difference of 0.37%).
| Demographics | Rating | Rank | Family Poverty |
| Lebanese | 57.6 /100 | #171 | Average 8.9% |
| Immigrants | Peru | 57.5 /100 | #172 | Average 8.9% |
| Immigrants | Fiji | 56.4 /100 | #173 | Average 8.9% |
| Immigrants | Albania | 50.0 /100 | #174 | Average 9.0% |
| Costa Ricans | 49.3 /100 | #175 | Average 9.0% |
| Immigrants | Syria | 47.5 /100 | #176 | Average 9.0% |
| Hawaiians | 47.2 /100 | #177 | Average 9.0% |
| Immigrants | Cameroon | 47.1 /100 | #178 | Average 9.0% |
| Immigrants | Iraq | 44.4 /100 | #179 | Average 9.1% |
| Immigrants | Uganda | 43.4 /100 | #180 | Average 9.1% |
| Hmong | 40.2 /100 | #181 | Average 9.1% |
| Immigrants | Morocco | 40.2 /100 | #182 | Average 9.1% |
| Uruguayans | 39.2 /100 | #183 | Fair 9.1% |
| South American Indians | 38.7 /100 | #184 | Fair 9.1% |
| Immigrants | Saudi Arabia | 38.6 /100 | #185 | Fair 9.1% |
Demographics Similar to Macedonians by Family Poverty
In terms of family poverty, the demographic groups most similar to Macedonians are Immigrants from Netherlands (7.7%, a difference of 0.19%), Immigrants from Greece (7.7%, a difference of 0.37%), European (7.7%, a difference of 0.38%), Finnish (7.7%, a difference of 0.39%), and Asian (7.7%, a difference of 0.42%).
| Demographics | Rating | Rank | Family Poverty |
| Immigrants | Eastern Asia | 98.7 /100 | #55 | Exceptional 7.7% |
| Immigrants | Serbia | 98.7 /100 | #56 | Exceptional 7.7% |
| Asians | 98.7 /100 | #57 | Exceptional 7.7% |
| Finns | 98.7 /100 | #58 | Exceptional 7.7% |
| Europeans | 98.7 /100 | #59 | Exceptional 7.7% |
| Immigrants | Greece | 98.7 /100 | #60 | Exceptional 7.7% |
| Immigrants | Netherlands | 98.6 /100 | #61 | Exceptional 7.7% |
| Macedonians | 98.6 /100 | #62 | Exceptional 7.8% |
| Zimbabweans | 98.4 /100 | #63 | Exceptional 7.8% |
| Koreans | 98.3 /100 | #64 | Exceptional 7.8% |
| Immigrants | Bulgaria | 98.3 /100 | #65 | Exceptional 7.8% |
| Dutch | 98.3 /100 | #66 | Exceptional 7.8% |
| Northern Europeans | 98.3 /100 | #67 | Exceptional 7.8% |
| Australians | 98.2 /100 | #68 | Exceptional 7.8% |
| Immigrants | Belgium | 98.2 /100 | #69 | Exceptional 7.8% |