Immigrants from Cameroon vs Latvian Female Poverty Among 18-24 Year Olds
COMPARE
Immigrants from Cameroon
Latvian
Female Poverty Among 18-24 Year Olds
Female Poverty Among 18-24 Year Olds Comparison
Immigrants from Cameroon
Latvians
19.3%
FEMALE POVERTY AMONG 18-24 YEAR OLDS
96.3/ 100
METRIC RATING
113th/ 347
METRIC RANK
19.5%
FEMALE POVERTY AMONG 18-24 YEAR OLDS
92.7/ 100
METRIC RATING
131st/ 347
METRIC RANK
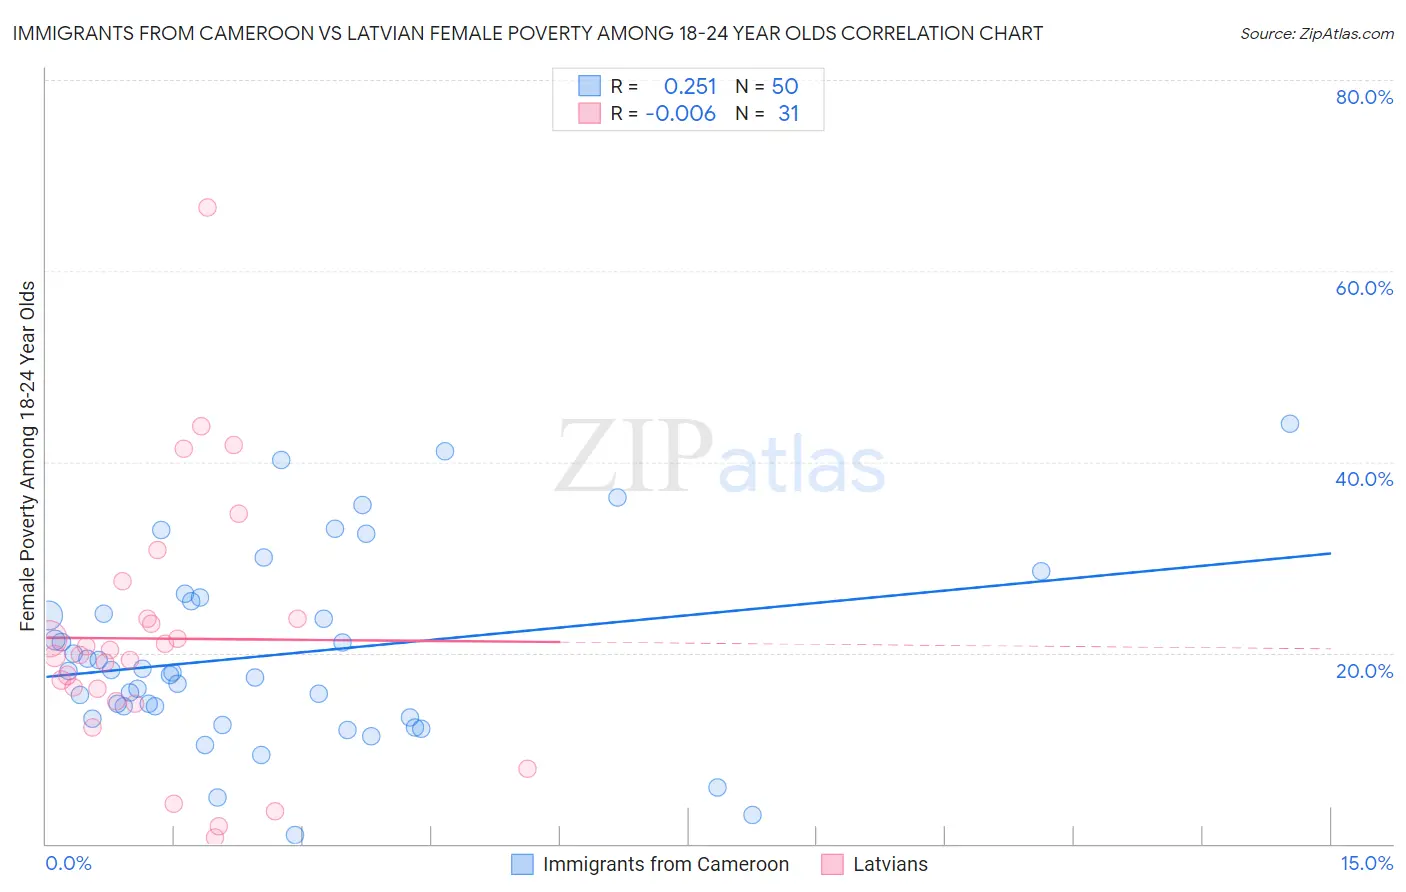
Immigrants from Cameroon vs Latvian Female Poverty Among 18-24 Year Olds Correlation Chart
The statistical analysis conducted on geographies consisting of 129,816,473 people shows a weak positive correlation between the proportion of Immigrants from Cameroon and poverty level among females between the ages 18 and 24 in the United States with a correlation coefficient (R) of 0.251 and weighted average of 19.3%. Similarly, the statistical analysis conducted on geographies consisting of 216,394,017 people shows no correlation between the proportion of Latvians and poverty level among females between the ages 18 and 24 in the United States with a correlation coefficient (R) of -0.006 and weighted average of 19.5%, a difference of 0.93%.
Female Poverty Among 18-24 Year Olds Correlation Summary
| Measurement | Immigrants from Cameroon | Latvian |
| Minimum | 0.87% | 0.67% |
| Maximum | 43.9% | 66.7% |
| Range | 43.1% | 66.0% |
| Mean | 19.8% | 21.5% |
| Median | 18.0% | 19.7% |
| Interquartile 25% (IQ1) | 13.2% | 15.0% |
| Interquartile 75% (IQ3) | 25.4% | 23.5% |
| Interquartile Range (IQR) | 12.2% | 8.6% |
| Standard Deviation (Sample) | 9.8% | 13.6% |
| Standard Deviation (Population) | 9.7% | 13.4% |
Demographics Similar to Immigrants from Cameroon and Latvians by Female Poverty Among 18-24 Year Olds
In terms of female poverty among 18-24 year olds, the demographic groups most similar to Immigrants from Cameroon are Slovene (19.3%, a difference of 0.040%), Immigrants from Hungary (19.3%, a difference of 0.050%), Immigrants from El Salvador (19.3%, a difference of 0.060%), Immigrants (19.3%, a difference of 0.15%), and Immigrants from Iran (19.3%, a difference of 0.19%). Similarly, the demographic groups most similar to Latvians are Slovak (19.5%, a difference of 0.040%), Immigrants from England (19.5%, a difference of 0.040%), Immigrants from Canada (19.5%, a difference of 0.040%), Jamaican (19.5%, a difference of 0.10%), and Cape Verdean (19.4%, a difference of 0.18%).
| Demographics | Rating | Rank | Female Poverty Among 18-24 Year Olds |
| Immigrants | El Salvador | 96.5 /100 | #112 | Exceptional 19.3% |
| Immigrants | Cameroon | 96.3 /100 | #113 | Exceptional 19.3% |
| Slovenes | 96.2 /100 | #114 | Exceptional 19.3% |
| Immigrants | Hungary | 96.2 /100 | #115 | Exceptional 19.3% |
| Immigrants | Immigrants | 95.9 /100 | #116 | Exceptional 19.3% |
| Immigrants | Iran | 95.8 /100 | #117 | Exceptional 19.3% |
| Immigrants | Guyana | 95.6 /100 | #118 | Exceptional 19.3% |
| Cypriots | 95.5 /100 | #119 | Exceptional 19.3% |
| Immigrants | Northern Europe | 95.4 /100 | #120 | Exceptional 19.4% |
| Guyanese | 95.3 /100 | #121 | Exceptional 19.4% |
| Cambodians | 94.6 /100 | #122 | Exceptional 19.4% |
| Paraguayans | 94.6 /100 | #123 | Exceptional 19.4% |
| Immigrants | Chile | 94.3 /100 | #124 | Exceptional 19.4% |
| Immigrants | Panama | 94.0 /100 | #125 | Exceptional 19.4% |
| Immigrants | Russia | 93.7 /100 | #126 | Exceptional 19.4% |
| Cape Verdeans | 93.6 /100 | #127 | Exceptional 19.4% |
| Slovaks | 92.9 /100 | #128 | Exceptional 19.5% |
| Immigrants | England | 92.9 /100 | #129 | Exceptional 19.5% |
| Immigrants | Canada | 92.9 /100 | #130 | Exceptional 19.5% |
| Latvians | 92.7 /100 | #131 | Exceptional 19.5% |
| Jamaicans | 92.1 /100 | #132 | Exceptional 19.5% |