Immigrants from Cameroon vs Immigrants from Turkey Seniors Poverty Over the Age of 65
COMPARE
Immigrants from Cameroon
Immigrants from Turkey
Seniors Poverty Over the Age of 65
Seniors Poverty Over the Age of 65 Comparison
Immigrants from Cameroon
Immigrants from Turkey
10.6%
SENIORS POVERTY OVER THE AGE OF 65
78.1/ 100
METRIC RATING
149th/ 347
METRIC RANK
10.5%
SENIORS POVERTY OVER THE AGE OF 65
87.7/ 100
METRIC RATING
132nd/ 347
METRIC RANK
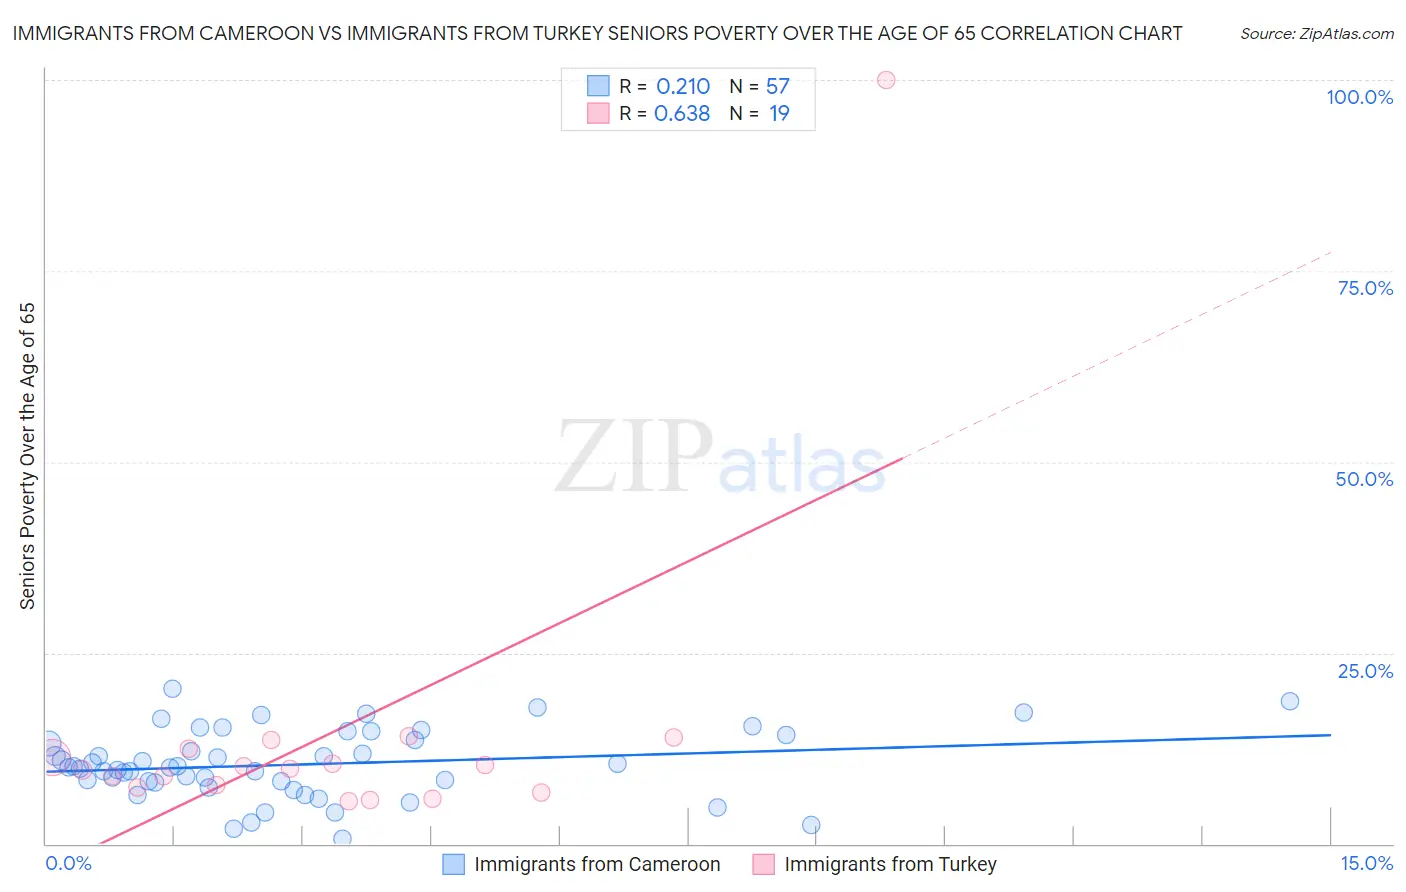
Immigrants from Cameroon vs Immigrants from Turkey Seniors Poverty Over the Age of 65 Correlation Chart
The statistical analysis conducted on geographies consisting of 130,481,344 people shows a weak positive correlation between the proportion of Immigrants from Cameroon and poverty level among seniors over the age of 65 in the United States with a correlation coefficient (R) of 0.210 and weighted average of 10.6%. Similarly, the statistical analysis conducted on geographies consisting of 222,593,467 people shows a significant positive correlation between the proportion of Immigrants from Turkey and poverty level among seniors over the age of 65 in the United States with a correlation coefficient (R) of 0.638 and weighted average of 10.5%, a difference of 1.6%.
Seniors Poverty Over the Age of 65 Correlation Summary
| Measurement | Immigrants from Cameroon | Immigrants from Turkey |
| Minimum | 0.58% | 5.6% |
| Maximum | 20.3% | 100.0% |
| Range | 19.7% | 94.4% |
| Mean | 10.4% | 14.3% |
| Median | 10.0% | 9.8% |
| Interquartile 25% (IQ1) | 8.1% | 7.3% |
| Interquartile 75% (IQ3) | 13.9% | 12.5% |
| Interquartile Range (IQR) | 5.9% | 5.2% |
| Standard Deviation (Sample) | 4.4% | 20.9% |
| Standard Deviation (Population) | 4.4% | 20.4% |
Demographics Similar to Immigrants from Cameroon and Immigrants from Turkey by Seniors Poverty Over the Age of 65
In terms of seniors poverty over the age of 65, the demographic groups most similar to Immigrants from Cameroon are American (10.6%, a difference of 0.0%), Immigrants from Switzerland (10.6%, a difference of 0.10%), Immigrants from Greece (10.6%, a difference of 0.13%), Alaskan Athabascan (10.6%, a difference of 0.15%), and Laotian (10.6%, a difference of 0.25%). Similarly, the demographic groups most similar to Immigrants from Turkey are Egyptian (10.5%, a difference of 0.010%), Guamanian/Chamorro (10.5%, a difference of 0.040%), Immigrants from Oceania (10.4%, a difference of 0.16%), Sierra Leonean (10.5%, a difference of 0.19%), and Immigrants from Norway (10.5%, a difference of 0.25%).
| Demographics | Rating | Rank | Seniors Poverty Over the Age of 65 |
| Immigrants | Oceania | 88.4 /100 | #130 | Excellent 10.4% |
| Egyptians | 87.8 /100 | #131 | Excellent 10.5% |
| Immigrants | Turkey | 87.7 /100 | #132 | Excellent 10.5% |
| Guamanians/Chamorros | 87.5 /100 | #133 | Excellent 10.5% |
| Sierra Leoneans | 86.8 /100 | #134 | Excellent 10.5% |
| Immigrants | Norway | 86.5 /100 | #135 | Excellent 10.5% |
| Immigrants | Serbia | 86.4 /100 | #136 | Excellent 10.5% |
| Immigrants | Australia | 85.1 /100 | #137 | Excellent 10.5% |
| Immigrants | Latvia | 84.7 /100 | #138 | Excellent 10.5% |
| Portuguese | 84.1 /100 | #139 | Excellent 10.5% |
| Immigrants | Kenya | 83.4 /100 | #140 | Excellent 10.5% |
| Immigrants | Europe | 83.3 /100 | #141 | Excellent 10.5% |
| Osage | 82.8 /100 | #142 | Excellent 10.6% |
| Immigrants | Asia | 80.8 /100 | #143 | Excellent 10.6% |
| Iraqis | 80.7 /100 | #144 | Excellent 10.6% |
| Laotians | 79.9 /100 | #145 | Good 10.6% |
| Alaskan Athabascans | 79.1 /100 | #146 | Good 10.6% |
| Immigrants | Greece | 79.0 /100 | #147 | Good 10.6% |
| Americans | 78.1 /100 | #148 | Good 10.6% |
| Immigrants | Cameroon | 78.1 /100 | #149 | Good 10.6% |
| Immigrants | Switzerland | 77.3 /100 | #150 | Good 10.6% |