Immigrants from Cameroon vs Immigrants from Japan Child Poverty Among Girls Under 16
COMPARE
Immigrants from Cameroon
Immigrants from Japan
Child Poverty Among Girls Under 16
Child Poverty Among Girls Under 16 Comparison
Immigrants from Cameroon
Immigrants from Japan
17.4%
CHILD POVERTY AMONG GIRLS UNDER 16
12.6/ 100
METRIC RATING
205th/ 347
METRIC RANK
13.3%
CHILD POVERTY AMONG GIRLS UNDER 16
99.9/ 100
METRIC RATING
20th/ 347
METRIC RANK
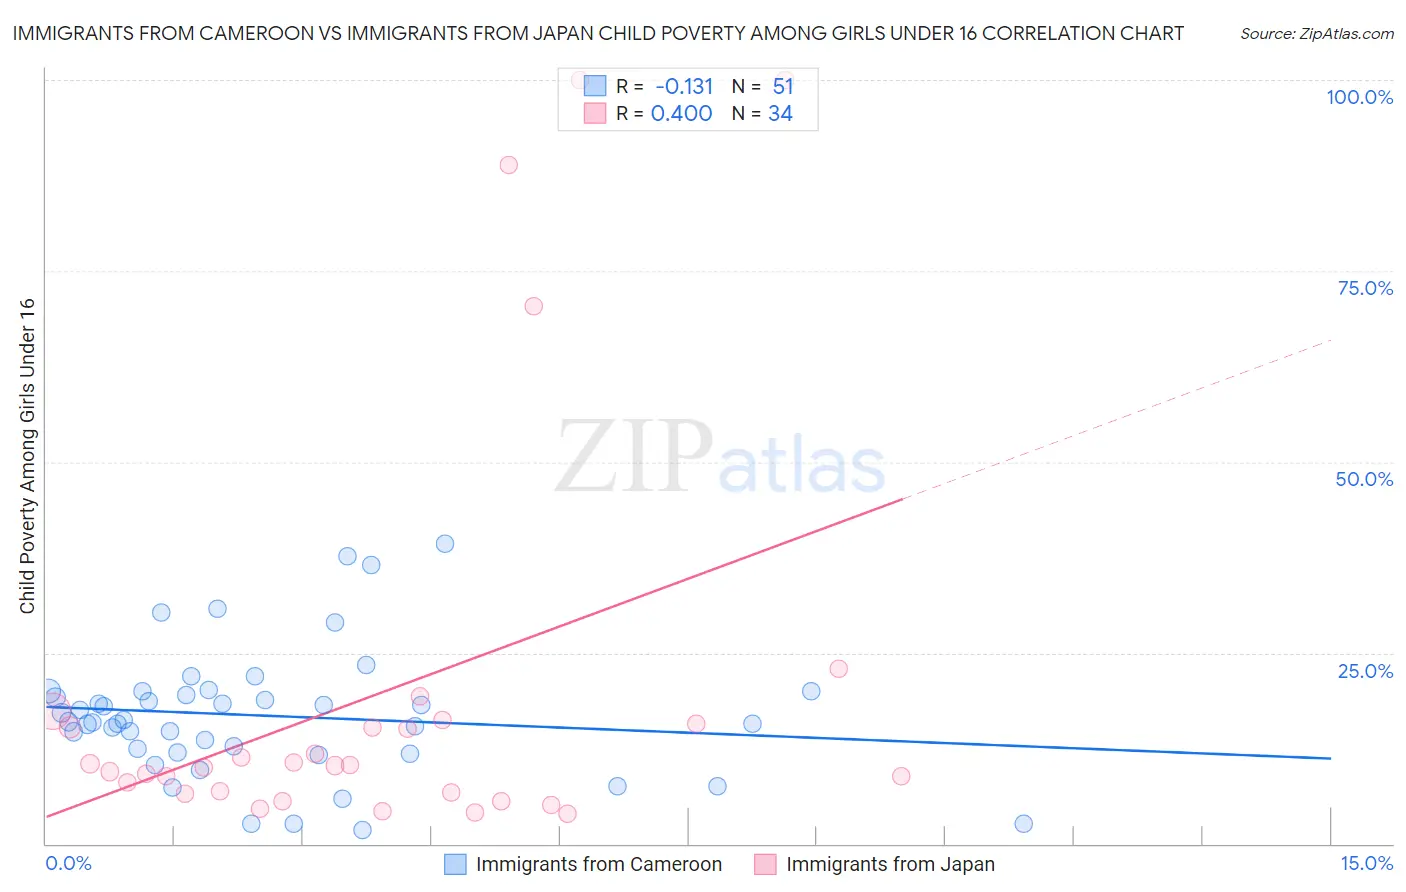
Immigrants from Cameroon vs Immigrants from Japan Child Poverty Among Girls Under 16 Correlation Chart
The statistical analysis conducted on geographies consisting of 130,176,141 people shows a poor negative correlation between the proportion of Immigrants from Cameroon and poverty level among girls under the age of 16 in the United States with a correlation coefficient (R) of -0.131 and weighted average of 17.4%. Similarly, the statistical analysis conducted on geographies consisting of 334,926,673 people shows a moderate positive correlation between the proportion of Immigrants from Japan and poverty level among girls under the age of 16 in the United States with a correlation coefficient (R) of 0.400 and weighted average of 13.3%, a difference of 30.9%.
Child Poverty Among Girls Under 16 Correlation Summary
| Measurement | Immigrants from Cameroon | Immigrants from Japan |
| Minimum | 1.8% | 3.9% |
| Maximum | 39.2% | 100.0% |
| Range | 37.4% | 96.1% |
| Mean | 16.8% | 19.7% |
| Median | 16.0% | 10.3% |
| Interquartile 25% (IQ1) | 11.9% | 6.7% |
| Interquartile 75% (IQ3) | 19.9% | 15.7% |
| Interquartile Range (IQR) | 8.0% | 9.1% |
| Standard Deviation (Sample) | 8.3% | 26.7% |
| Standard Deviation (Population) | 8.2% | 26.4% |
Similar Demographics by Child Poverty Among Girls Under 16
Demographics Similar to Immigrants from Cameroon by Child Poverty Among Girls Under 16
In terms of child poverty among girls under 16, the demographic groups most similar to Immigrants from Cameroon are Iraqi (17.4%, a difference of 0.10%), Delaware (17.4%, a difference of 0.27%), Hmong (17.5%, a difference of 0.52%), Sierra Leonean (17.6%, a difference of 1.1%), and Ugandan (17.2%, a difference of 1.1%).
| Demographics | Rating | Rank | Child Poverty Among Girls Under 16 |
| Immigrants | Lebanon | 22.6 /100 | #198 | Fair 17.1% |
| Immigrants | Afghanistan | 22.4 /100 | #199 | Fair 17.1% |
| Immigrants | Uzbekistan | 21.5 /100 | #200 | Fair 17.1% |
| Immigrants | Kenya | 17.8 /100 | #201 | Poor 17.2% |
| Immigrants | Sierra Leone | 17.6 /100 | #202 | Poor 17.2% |
| Ugandans | 17.5 /100 | #203 | Poor 17.2% |
| Iraqis | 13.0 /100 | #204 | Poor 17.4% |
| Immigrants | Cameroon | 12.6 /100 | #205 | Poor 17.4% |
| Delaware | 11.5 /100 | #206 | Poor 17.4% |
| Hmong | 10.6 /100 | #207 | Poor 17.5% |
| Sierra Leoneans | 8.9 /100 | #208 | Tragic 17.6% |
| Panamanians | 8.7 /100 | #209 | Tragic 17.6% |
| Immigrants | Immigrants | 7.3 /100 | #210 | Tragic 17.7% |
| Immigrants | Eastern Africa | 6.4 /100 | #211 | Tragic 17.7% |
| Immigrants | Thailand | 6.3 /100 | #212 | Tragic 17.7% |
Demographics Similar to Immigrants from Japan by Child Poverty Among Girls Under 16
In terms of child poverty among girls under 16, the demographic groups most similar to Immigrants from Japan are Assyrian/Chaldean/Syriac (13.3%, a difference of 0.12%), Indian (Asian) (13.3%, a difference of 0.32%), Norwegian (13.3%, a difference of 0.49%), Immigrants from Eastern Asia (13.4%, a difference of 0.58%), and Cypriot (13.2%, a difference of 0.66%).
| Demographics | Rating | Rank | Child Poverty Among Girls Under 16 |
| Immigrants | Ireland | 99.9 /100 | #13 | Exceptional 12.9% |
| Burmese | 99.9 /100 | #14 | Exceptional 13.0% |
| Okinawans | 99.9 /100 | #15 | Exceptional 13.0% |
| Immigrants | Lithuania | 99.9 /100 | #16 | Exceptional 13.1% |
| Bulgarians | 99.9 /100 | #17 | Exceptional 13.1% |
| Immigrants | Korea | 99.9 /100 | #18 | Exceptional 13.1% |
| Cypriots | 99.9 /100 | #19 | Exceptional 13.2% |
| Immigrants | Japan | 99.9 /100 | #20 | Exceptional 13.3% |
| Assyrians/Chaldeans/Syriacs | 99.9 /100 | #21 | Exceptional 13.3% |
| Indians (Asian) | 99.9 /100 | #22 | Exceptional 13.3% |
| Norwegians | 99.9 /100 | #23 | Exceptional 13.3% |
| Immigrants | Eastern Asia | 99.9 /100 | #24 | Exceptional 13.4% |
| Immigrants | China | 99.8 /100 | #25 | Exceptional 13.4% |
| Eastern Europeans | 99.8 /100 | #26 | Exceptional 13.5% |
| Latvians | 99.8 /100 | #27 | Exceptional 13.5% |