Immigrants from Cameroon vs Afghan Female Poverty Among 25-34 Year Olds
COMPARE
Immigrants from Cameroon
Afghan
Female Poverty Among 25-34 Year Olds
Female Poverty Among 25-34 Year Olds Comparison
Immigrants from Cameroon
Afghans
13.3%
FEMALE POVERTY AMONG 25-34 YEAR OLDS
72.0/ 100
METRIC RATING
156th/ 347
METRIC RANK
13.0%
FEMALE POVERTY AMONG 25-34 YEAR OLDS
85.8/ 100
METRIC RATING
134th/ 347
METRIC RANK
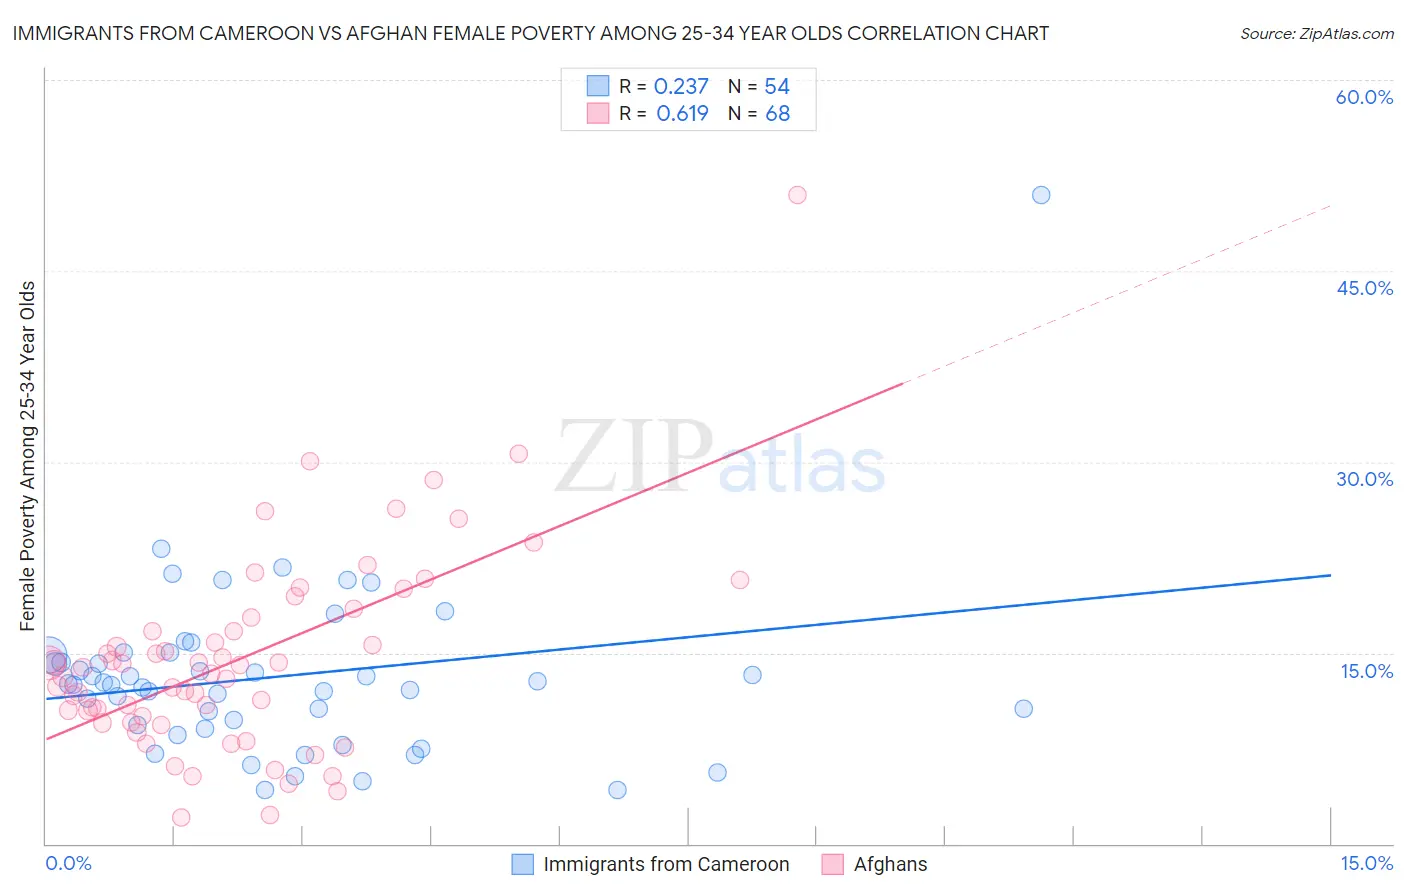
Immigrants from Cameroon vs Afghan Female Poverty Among 25-34 Year Olds Correlation Chart
The statistical analysis conducted on geographies consisting of 130,163,869 people shows a weak positive correlation between the proportion of Immigrants from Cameroon and poverty level among females between the ages 25 and 34 in the United States with a correlation coefficient (R) of 0.237 and weighted average of 13.3%. Similarly, the statistical analysis conducted on geographies consisting of 147,945,661 people shows a significant positive correlation between the proportion of Afghans and poverty level among females between the ages 25 and 34 in the United States with a correlation coefficient (R) of 0.619 and weighted average of 13.0%, a difference of 1.8%.
Female Poverty Among 25-34 Year Olds Correlation Summary
| Measurement | Immigrants from Cameroon | Afghan |
| Minimum | 4.3% | 2.0% |
| Maximum | 50.9% | 50.9% |
| Range | 46.7% | 48.9% |
| Mean | 13.1% | 14.5% |
| Median | 12.5% | 13.6% |
| Interquartile 25% (IQ1) | 9.3% | 9.8% |
| Interquartile 75% (IQ3) | 14.8% | 17.2% |
| Interquartile Range (IQR) | 5.5% | 7.5% |
| Standard Deviation (Sample) | 7.0% | 7.9% |
| Standard Deviation (Population) | 6.9% | 7.8% |
Similar Demographics by Female Poverty Among 25-34 Year Olds
Demographics Similar to Immigrants from Cameroon by Female Poverty Among 25-34 Year Olds
In terms of female poverty among 25-34 year olds, the demographic groups most similar to Immigrants from Cameroon are Immigrants from Sierra Leone (13.3%, a difference of 0.090%), Arab (13.2%, a difference of 0.16%), Immigrants from Western Europe (13.3%, a difference of 0.17%), Northern European (13.2%, a difference of 0.18%), and Immigrants from Colombia (13.3%, a difference of 0.28%).
| Demographics | Rating | Rank | Female Poverty Among 25-34 Year Olds |
| Sierra Leoneans | 76.3 /100 | #149 | Good 13.2% |
| Iraqis | 76.0 /100 | #150 | Good 13.2% |
| Costa Ricans | 75.8 /100 | #151 | Good 13.2% |
| Slavs | 75.7 /100 | #152 | Good 13.2% |
| Northern Europeans | 73.7 /100 | #153 | Good 13.2% |
| Arabs | 73.5 /100 | #154 | Good 13.2% |
| Immigrants | Sierra Leone | 72.9 /100 | #155 | Good 13.3% |
| Immigrants | Cameroon | 72.0 /100 | #156 | Good 13.3% |
| Immigrants | Western Europe | 70.3 /100 | #157 | Good 13.3% |
| Immigrants | Colombia | 69.2 /100 | #158 | Good 13.3% |
| Uruguayans | 66.9 /100 | #159 | Good 13.3% |
| Immigrants | South America | 66.3 /100 | #160 | Good 13.3% |
| Icelanders | 65.7 /100 | #161 | Good 13.3% |
| Ugandans | 64.1 /100 | #162 | Good 13.4% |
| British | 63.5 /100 | #163 | Good 13.4% |
Demographics Similar to Afghans by Female Poverty Among 25-34 Year Olds
In terms of female poverty among 25-34 year olds, the demographic groups most similar to Afghans are South African (13.0%, a difference of 0.020%), Immigrants from England (13.0%, a difference of 0.040%), Immigrants from Chile (13.1%, a difference of 0.20%), Brazilian (13.1%, a difference of 0.22%), and Austrian (13.1%, a difference of 0.34%).
| Demographics | Rating | Rank | Female Poverty Among 25-34 Year Olds |
| Czechs | 90.3 /100 | #127 | Exceptional 12.9% |
| Syrians | 90.2 /100 | #128 | Exceptional 12.9% |
| Immigrants | North America | 89.7 /100 | #129 | Excellent 12.9% |
| Immigrants | Uzbekistan | 89.6 /100 | #130 | Excellent 12.9% |
| Pakistanis | 88.4 /100 | #131 | Excellent 13.0% |
| Immigrants | Hungary | 88.3 /100 | #132 | Excellent 13.0% |
| Serbians | 87.6 /100 | #133 | Excellent 13.0% |
| Afghans | 85.8 /100 | #134 | Excellent 13.0% |
| South Africans | 85.7 /100 | #135 | Excellent 13.0% |
| Immigrants | England | 85.5 /100 | #136 | Excellent 13.0% |
| Immigrants | Chile | 84.6 /100 | #137 | Excellent 13.1% |
| Brazilians | 84.5 /100 | #138 | Excellent 13.1% |
| Austrians | 83.7 /100 | #139 | Excellent 13.1% |
| Immigrants | Iraq | 83.6 /100 | #140 | Excellent 13.1% |
| New Zealanders | 83.4 /100 | #141 | Excellent 13.1% |