Immigrants from Cambodia vs Ute Child Poverty Among Girls Under 16

COMPARE

Immigrants from Cambodia
Race
Ancestry
AfghanAfricanAlaska NativeAlaskan AthabascanAlbanianAleutAlsatianAmericanApacheArabArapahoArgentineanArmenianAssyrian/Chaldean/SyriacAustralianAustrianBahamianBangladeshiBarbadianBasqueBelgianBelizeanBermudanBhutaneseBlackfeetBolivianBrazilianBritishBritish West IndianBulgarianBurmeseCajunCambodianCanadianCape VerdeanCarpatho RusynCelticCentral AmericanCentral American IndianCherokeeCheyenneChickasawChileanChineseChippewaChoctawColombianColvilleComancheCosta RicanCreeCreekCroatianCrowCubanCypriotCzechCzechoslovakianDanishDelawareDominicanDutchDutch West IndianEastern EuropeanEcuadorianEgyptianEnglishEstonianEthiopianEuropeanFijianFilipinoFinnishFrenchFrench American IndianFrench CanadianGermanGerman RussianGhanaianGreekGuamanian/ChamorroGuatemalanGuyaneseHaitianHmongHonduranHopiHoumaHungarianIcelanderIndian (Asian)IndonesianInupiatIranianIraqiIrishIroquoisIsraeliItalianJamaicanJapaneseJordanianKenyanKiowaKoreanLaotianLatvianLebaneseLiberianLithuanianLumbeeLuxembourgerMacedonianMalaysianMalteseMarshalleseMenomineeMexicanMexican American IndianMongolianMoroccanNative HawaiianNavajoNepaleseNew ZealanderNicaraguanNigerianNorthern EuropeanNorwegianOkinawanOsageOttawaPaiutePakistaniPalestinianPanamanianParaguayanPennsylvania GermanPeruvianPimaPolishPortuguesePotawatomiPuebloPuerto RicanPuget Sound SalishRomanianRussianSalvadoranSamoanScandinavianScotch-IrishScottishSeminoleSenegaleseSerbianShoshoneSierra LeoneanSiouxSlavicSlovakSloveneSomaliSouth AfricanSouth AmericanSouth American IndianSoviet UnionSpaniardSpanishSpanish AmericanSpanish American IndianSri LankanSubsaharan AfricanSudaneseSwedishSwissSyrianTaiwaneseThaiTlingit-HaidaTohono O'OdhamTonganTrinidadian and TobagonianTsimshianTurkishU.S. Virgin IslanderUgandanUkrainianUruguayanVenezuelanVietnameseWelshWest IndianYakamaYaquiYugoslavianYumanYup'ikZimbabwean
Immigration
NonimmigrantsImmigrantsAfghanistanAfricaAlbaniaArgentinaArmeniaAsiaAustraliaAustriaBahamasBangladeshBarbadosBelarusBelgiumBelizeBoliviaBosnia and HerzegovinaBrazilBulgariaBurma/MyanmarCabo VerdeCambodiaCameroonCanadaCaribbeanCentral AmericaChileChinaColombiaCongoCosta RicaCroatiaCubaCzechoslovakiaDenmarkDominicaDominican RepublicEastern AfricaEastern AsiaEastern EuropeEcuadorEgyptEl SalvadorEnglandEritreaEthiopiaEuropeFijiFranceGermanyGhanaGreeceGrenadaGuatemalaGuyanaHaitiHondurasHong KongHungaryIndiaIndonesiaIranIraqIrelandIsraelItalyJamaicaJapanJordanKazakhstanKenyaKoreaKuwaitLaosLatin AmericaLatviaLebanonLiberiaLithuaniaMalaysiaMexicoMicronesiaMiddle AfricaMoldovaMoroccoNepalNetherlandsNicaraguaNigeriaNorth AmericaNorth MacedoniaNorthern AfricaNorthern EuropeNorwayOceaniaPakistanPanamaPeruPhilippinesPolandPortugalRomaniaRussiaSaudi ArabiaScotlandSenegalSerbiaSierra LeoneSingaporeSomaliaSouth AfricaSouth AmericaSouth Central AsiaSouth Eastern AsiaSouthern EuropeSpainSri LankaSt. Vincent and the GrenadinesSudanSwedenSwitzerlandSyriaTaiwanThailandTrinidad and TobagoTurkeyUgandaUkraineUruguayUzbekistanVenezuelaVietnamWest IndiesWestern AfricaWestern AsiaWestern EuropeYemenZaireZimbabweAzores
Ute
Race
Ancestry
AfghanAfricanAlaska NativeAlaskan AthabascanAlbanianAleutAlsatianAmericanApacheArabArapahoArgentineanArmenianAssyrian/Chaldean/SyriacAustralianAustrianBahamianBangladeshiBarbadianBasqueBelgianBelizeanBermudanBhutaneseBlackfeetBolivianBrazilianBritishBritish West IndianBulgarianBurmeseCajunCambodianCanadianCape VerdeanCarpatho RusynCelticCentral AmericanCentral American IndianCherokeeCheyenneChickasawChileanChineseChippewaChoctawColombianColvilleComancheCosta RicanCreeCreekCroatianCrowCubanCypriotCzechCzechoslovakianDanishDelawareDominicanDutchDutch West IndianEastern EuropeanEcuadorianEgyptianEnglishEstonianEthiopianEuropeanFijianFilipinoFinnishFrenchFrench American IndianFrench CanadianGermanGerman RussianGhanaianGreekGuamanian/ChamorroGuatemalanGuyaneseHaitianHmongHonduranHopiHoumaHungarianIcelanderIndian (Asian)IndonesianInupiatIranianIraqiIrishIroquoisIsraeliItalianJamaicanJapaneseJordanianKenyanKiowaKoreanLaotianLatvianLebaneseLiberianLithuanianLumbeeLuxembourgerMacedonianMalaysianMalteseMarshalleseMenomineeMexicanMexican American IndianMongolianMoroccanNative HawaiianNavajoNepaleseNew ZealanderNicaraguanNigerianNorthern EuropeanNorwegianOkinawanOsageOttawaPaiutePakistaniPalestinianPanamanianParaguayanPennsylvania GermanPeruvianPimaPolishPortuguesePotawatomiPuebloPuerto RicanPuget Sound SalishRomanianRussianSalvadoranSamoanScandinavianScotch-IrishScottishSeminoleSenegaleseSerbianShoshoneSierra LeoneanSiouxSlavicSlovakSloveneSomaliSouth AfricanSouth AmericanSouth American IndianSoviet UnionSpaniardSpanishSpanish AmericanSpanish American IndianSri LankanSubsaharan AfricanSudaneseSwedishSwissSyrianTaiwaneseThaiTlingit-HaidaTohono O'OdhamTonganTrinidadian and TobagonianTsimshianTurkishU.S. Virgin IslanderUgandanUkrainianUruguayanUteVenezuelanVietnameseWelshWest IndianYakamaYaquiYugoslavianYumanYup'ikZimbabwean
Immigration
NonimmigrantsImmigrantsAfghanistanAfricaAlbaniaArgentinaArmeniaAsiaAustraliaAustriaBahamasBangladeshBarbadosBelarusBelgiumBelizeBoliviaBosnia and HerzegovinaBrazilBulgariaBurma/MyanmarCabo VerdeCameroonCanadaCaribbeanCentral AmericaChileChinaColombiaCongoCosta RicaCroatiaCubaCzechoslovakiaDenmarkDominicaDominican RepublicEastern AfricaEastern AsiaEastern EuropeEcuadorEgyptEl SalvadorEnglandEritreaEthiopiaEuropeFijiFranceGermanyGhanaGreeceGrenadaGuatemalaGuyanaHaitiHondurasHong KongHungaryIndiaIndonesiaIranIraqIrelandIsraelItalyJamaicaJapanJordanKazakhstanKenyaKoreaKuwaitLaosLatin AmericaLatviaLebanonLiberiaLithuaniaMalaysiaMexicoMicronesiaMiddle AfricaMoldovaMoroccoNepalNetherlandsNicaraguaNigeriaNorth AmericaNorth MacedoniaNorthern AfricaNorthern EuropeNorwayOceaniaPakistanPanamaPeruPhilippinesPolandPortugalRomaniaRussiaSaudi ArabiaScotlandSenegalSerbiaSierra LeoneSingaporeSomaliaSouth AfricaSouth AmericaSouth Central AsiaSouth Eastern AsiaSouthern EuropeSpainSri LankaSt. Vincent and the GrenadinesSudanSwedenSwitzerlandSyriaTaiwanThailandTrinidad and TobagoTurkeyUgandaUkraineUruguayUzbekistanVenezuelaVietnamWest IndiesWestern AfricaWestern AsiaWestern EuropeYemenZaireZimbabweAzores
Child Poverty Among Girls Under 16
Income
Poverty
Unemployment
Labor Participation
Family Structure
Vehicle Availability
Education Level
Disability

Child Poverty Among Girls Under 16 Comparison

Immigrants from Cambodia

Ute

Tragic
Tragic
18.1%
CHILD POVERTY AMONG GIRLS UNDER 16
2.9/ 100
METRIC RATING
222nd/ 347
METRIC RANK
21.8%
CHILD POVERTY AMONG GIRLS UNDER 16
0.0/ 100
METRIC RATING
315th/ 347
METRIC RANK

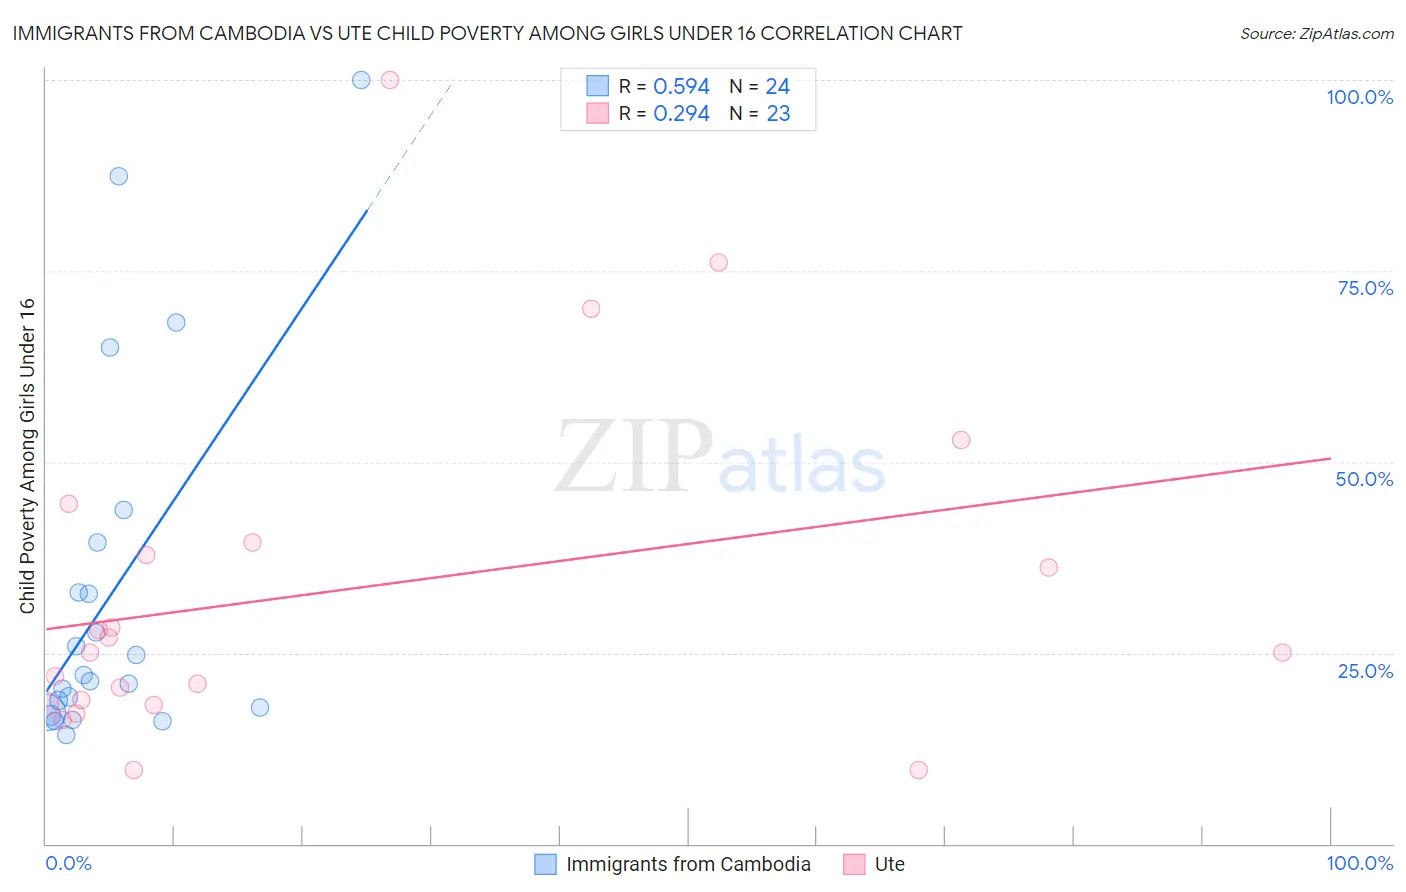
Immigrants from Cambodia vs Ute Child Poverty Among Girls Under 16 Correlation Chart

The statistical analysis conducted on geographies consisting of 204,042,546 people shows a substantial positive correlation between the proportion of Immigrants from Cambodia and poverty level among girls under the age of 16 in the United States with a correlation coefficient (R) of 0.594 and weighted average of 18.1%. Similarly, the statistical analysis conducted on geographies consisting of 55,563,406 people shows a weak positive correlation between the proportion of Ute and poverty level among girls under the age of 16 in the United States with a correlation coefficient (R) of 0.294 and weighted average of 21.8%, a difference of 20.3%.
Immigrants from Cambodia vs Ute Child Poverty Among Girls Under 16

Child Poverty Among Girls Under 16 Correlation Summary

MeasurementImmigrants from CambodiaUte
Minimum14.3%9.6%
Maximum100.0%100.0%
Range85.7%90.4%
Mean32.7%33.1%
Median21.7%25.0%
Interquartile 25% (IQ1)17.4%18.3%
Interquartile 75% (IQ3)36.1%39.5%
Interquartile Range (IQR)18.7%21.2%
Standard Deviation (Sample)23.7%22.6%
Standard Deviation (Population)23.2%22.1%

Similar Demographics by Child Poverty Among Girls Under 16

Demographics Similar to Immigrants from Cambodia by Child Poverty Among Girls Under 16

In terms of child poverty among girls under 16, the demographic groups most similar to Immigrants from Cambodia are Immigrants from Armenia (18.1%, a difference of 0.0%), Bermudan (18.1%, a difference of 0.080%), Immigrants from Africa (18.2%, a difference of 0.17%), Nicaraguan (18.2%, a difference of 0.50%), and Immigrants from Micronesia (18.0%, a difference of 0.52%).
DemographicsRating | RankChild Poverty Among Girls Under 16
German Russians
5.7
/100
|
#215
Tragic
17.8%
Moroccans
5.5
/100
|
#216
Tragic
17.8%
Japanese
5.3
/100
|
#217
Tragic
17.8%
Alaska Natives
5.2
/100
|
#218
Tragic
17.8%
Immigrants | Panama
4.7
/100
|
#219
Tragic
17.9%
Cubans
4.1
/100
|
#220
Tragic
18.0%
Immigrants | Micronesia
3.5
/100
|
#221
Tragic
18.0%
Immigrants | Cambodia
2.9
/100
|
#222
Tragic
18.1%
Immigrants | Armenia
2.9
/100
|
#223
Tragic
18.1%
Bermudans
2.8
/100
|
#224
Tragic
18.1%
Immigrants | Africa
2.7
/100
|
#225
Tragic
18.2%
Nicaraguans
2.4
/100
|
#226
Tragic
18.2%
Immigrants | Nonimmigrants
2.0
/100
|
#227
Tragic
18.3%
Alaskan Athabascans
2.0
/100
|
#228
Tragic
18.3%
Ghanaians
1.4
/100
|
#229
Tragic
18.5%

Demographics Similar to Ute by Child Poverty Among Girls Under 16

In terms of child poverty among girls under 16, the demographic groups most similar to Ute are Immigrants from Guatemala (21.9%, a difference of 0.27%), Arapaho (21.7%, a difference of 0.28%), Creek (21.7%, a difference of 0.29%), African (21.9%, a difference of 0.59%), and Immigrants from Mexico (21.6%, a difference of 0.80%).
DemographicsRating | RankChild Poverty Among Girls Under 16
Houma
0.0
/100
|
#308
Tragic
21.5%
Bahamians
0.0
/100
|
#309
Tragic
21.5%
Immigrants | Somalia
0.0
/100
|
#310
Tragic
21.6%
Dutch West Indians
0.0
/100
|
#311
Tragic
21.6%
Immigrants | Mexico
0.0
/100
|
#312
Tragic
21.6%
Creek
0.0
/100
|
#313
Tragic
21.7%
Arapaho
0.0
/100
|
#314
Tragic
21.7%
Ute
0.0
/100
|
#315
Tragic
21.8%
Immigrants | Guatemala
0.0
/100
|
#316
Tragic
21.9%
Africans
0.0
/100
|
#317
Tragic
21.9%
Immigrants | Dominica
0.0
/100
|
#318
Tragic
22.1%
U.S. Virgin Islanders
0.0
/100
|
#319
Tragic
22.1%
Hondurans
0.0
/100
|
#320
Tragic
22.2%
Colville
0.0
/100
|
#321
Tragic
22.5%
Yakama
0.0
/100
|
#322
Tragic
22.6%