Immigrants from Cambodia vs Eastern European Seniors Poverty Over the Age of 65
COMPARE
Immigrants from Cambodia
Eastern European
Seniors Poverty Over the Age of 65
Seniors Poverty Over the Age of 65 Comparison
Immigrants from Cambodia
Eastern Europeans
12.4%
SENIORS POVERTY OVER THE AGE OF 65
0.3/ 100
METRIC RATING
254th/ 347
METRIC RANK
9.6%
SENIORS POVERTY OVER THE AGE OF 65
99.6/ 100
METRIC RATING
43rd/ 347
METRIC RANK
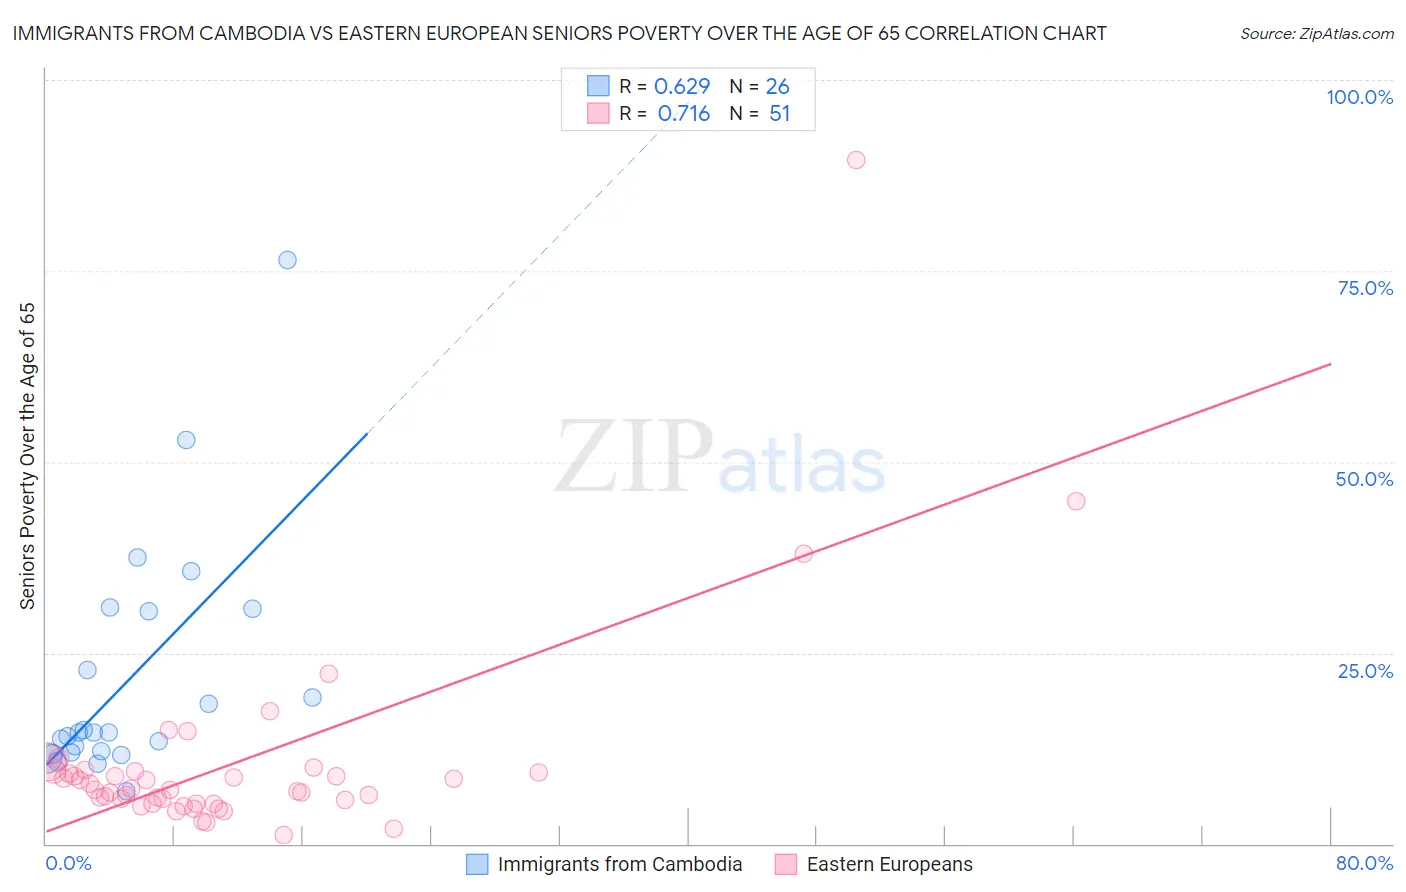
Immigrants from Cambodia vs Eastern European Seniors Poverty Over the Age of 65 Correlation Chart
The statistical analysis conducted on geographies consisting of 204,964,424 people shows a significant positive correlation between the proportion of Immigrants from Cambodia and poverty level among seniors over the age of 65 in the United States with a correlation coefficient (R) of 0.629 and weighted average of 12.4%. Similarly, the statistical analysis conducted on geographies consisting of 459,049,603 people shows a strong positive correlation between the proportion of Eastern Europeans and poverty level among seniors over the age of 65 in the United States with a correlation coefficient (R) of 0.716 and weighted average of 9.6%, a difference of 28.6%.
Seniors Poverty Over the Age of 65 Correlation Summary
| Measurement | Immigrants from Cambodia | Eastern European |
| Minimum | 6.8% | 1.1% |
| Maximum | 76.5% | 89.5% |
| Range | 69.6% | 88.4% |
| Mean | 21.3% | 10.6% |
| Median | 14.6% | 7.0% |
| Interquartile 25% (IQ1) | 12.0% | 5.2% |
| Interquartile 75% (IQ3) | 30.5% | 9.4% |
| Interquartile Range (IQR) | 18.5% | 4.2% |
| Standard Deviation (Sample) | 15.6% | 13.6% |
| Standard Deviation (Population) | 15.3% | 13.5% |
Similar Demographics by Seniors Poverty Over the Age of 65
Demographics Similar to Immigrants from Cambodia by Seniors Poverty Over the Age of 65
In terms of seniors poverty over the age of 65, the demographic groups most similar to Immigrants from Cambodia are Mexican American Indian (12.4%, a difference of 0.13%), Shoshone (12.3%, a difference of 0.22%), Armenian (12.3%, a difference of 0.35%), Immigrants from Panama (12.4%, a difference of 0.36%), and Immigrants (12.4%, a difference of 0.37%).
| Demographics | Rating | Rank | Seniors Poverty Over the Age of 65 |
| Japanese | 0.6 /100 | #247 | Tragic 12.2% |
| Spanish Americans | 0.6 /100 | #248 | Tragic 12.2% |
| Ute | 0.6 /100 | #249 | Tragic 12.2% |
| Immigrants | Liberia | 0.5 /100 | #250 | Tragic 12.2% |
| Somalis | 0.3 /100 | #251 | Tragic 12.3% |
| Armenians | 0.3 /100 | #252 | Tragic 12.3% |
| Shoshone | 0.3 /100 | #253 | Tragic 12.3% |
| Immigrants | Cambodia | 0.3 /100 | #254 | Tragic 12.4% |
| Mexican American Indians | 0.3 /100 | #255 | Tragic 12.4% |
| Immigrants | Panama | 0.2 /100 | #256 | Tragic 12.4% |
| Immigrants | Immigrants | 0.2 /100 | #257 | Tragic 12.4% |
| Dutch West Indians | 0.2 /100 | #258 | Tragic 12.4% |
| Ghanaians | 0.2 /100 | #259 | Tragic 12.4% |
| South Americans | 0.2 /100 | #260 | Tragic 12.5% |
| Colombians | 0.2 /100 | #261 | Tragic 12.5% |
Demographics Similar to Eastern Europeans by Seniors Poverty Over the Age of 65
In terms of seniors poverty over the age of 65, the demographic groups most similar to Eastern Europeans are Zimbabwean (9.6%, a difference of 0.10%), Austrian (9.6%, a difference of 0.10%), Immigrants from North Macedonia (9.6%, a difference of 0.26%), Estonian (9.6%, a difference of 0.28%), and Assyrian/Chaldean/Syriac (9.6%, a difference of 0.42%).
| Demographics | Rating | Rank | Seniors Poverty Over the Age of 65 |
| Czechoslovakians | 99.8 /100 | #36 | Exceptional 9.5% |
| Scotch-Irish | 99.7 /100 | #37 | Exceptional 9.5% |
| Belgians | 99.7 /100 | #38 | Exceptional 9.5% |
| Greeks | 99.6 /100 | #39 | Exceptional 9.6% |
| Assyrians/Chaldeans/Syriacs | 99.6 /100 | #40 | Exceptional 9.6% |
| Immigrants | North Macedonia | 99.6 /100 | #41 | Exceptional 9.6% |
| Zimbabweans | 99.6 /100 | #42 | Exceptional 9.6% |
| Eastern Europeans | 99.6 /100 | #43 | Exceptional 9.6% |
| Austrians | 99.5 /100 | #44 | Exceptional 9.6% |
| Estonians | 99.5 /100 | #45 | Exceptional 9.6% |
| Immigrants | Taiwan | 99.5 /100 | #46 | Exceptional 9.7% |
| Immigrants | South Central Asia | 99.5 /100 | #47 | Exceptional 9.7% |
| French | 99.5 /100 | #48 | Exceptional 9.7% |
| Immigrants | Lithuania | 99.4 /100 | #49 | Exceptional 9.7% |
| Hungarians | 99.4 /100 | #50 | Exceptional 9.7% |