Immigrants from Burma/Myanmar vs Immigrants from Chile Family Poverty
COMPARE
Immigrants from Burma/Myanmar
Immigrants from Chile
Family Poverty
Family Poverty Comparison
Immigrants from Burma/Myanmar
Immigrants from Chile
10.5%
FAMILY POVERTY
0.6/ 100
METRIC RATING
245th/ 347
METRIC RANK
8.9%
FAMILY POVERTY
59.6/ 100
METRIC RATING
169th/ 347
METRIC RANK
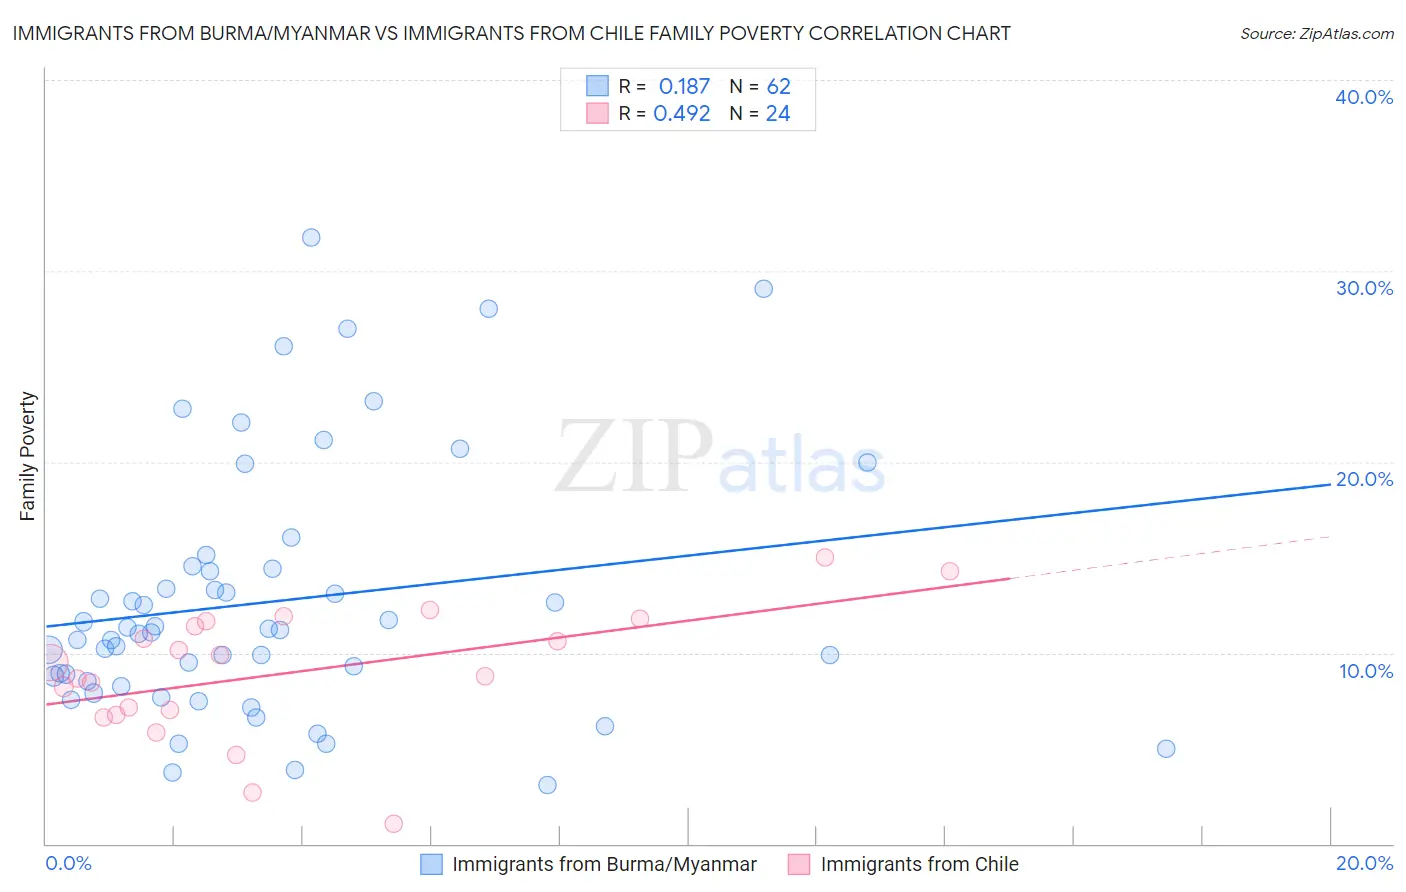
Immigrants from Burma/Myanmar vs Immigrants from Chile Family Poverty Correlation Chart
The statistical analysis conducted on geographies consisting of 172,175,970 people shows a poor positive correlation between the proportion of Immigrants from Burma/Myanmar and poverty level among families in the United States with a correlation coefficient (R) of 0.187 and weighted average of 10.5%. Similarly, the statistical analysis conducted on geographies consisting of 218,435,761 people shows a moderate positive correlation between the proportion of Immigrants from Chile and poverty level among families in the United States with a correlation coefficient (R) of 0.492 and weighted average of 8.9%, a difference of 18.4%.
Family Poverty Correlation Summary
| Measurement | Immigrants from Burma/Myanmar | Immigrants from Chile |
| Minimum | 3.0% | 1.0% |
| Maximum | 31.7% | 15.0% |
| Range | 28.7% | 14.0% |
| Mean | 12.7% | 9.0% |
| Median | 11.1% | 9.2% |
| Interquartile 25% (IQ1) | 8.5% | 6.9% |
| Interquartile 75% (IQ3) | 14.4% | 11.5% |
| Interquartile Range (IQR) | 5.8% | 4.6% |
| Standard Deviation (Sample) | 6.6% | 3.4% |
| Standard Deviation (Population) | 6.6% | 3.3% |
Similar Demographics by Family Poverty
Demographics Similar to Immigrants from Burma/Myanmar by Family Poverty
In terms of family poverty, the demographic groups most similar to Immigrants from Burma/Myanmar are Cree (10.5%, a difference of 0.61%), Cherokee (10.6%, a difference of 0.64%), Liberian (10.6%, a difference of 0.73%), Nicaraguan (10.6%, a difference of 0.93%), and Cuban (10.6%, a difference of 0.98%).
| Demographics | Rating | Rank | Family Poverty |
| French American Indians | 1.5 /100 | #238 | Tragic 10.2% |
| Potawatomi | 1.5 /100 | #239 | Tragic 10.2% |
| Immigrants | Azores | 1.4 /100 | #240 | Tragic 10.3% |
| Ghanaians | 1.3 /100 | #241 | Tragic 10.3% |
| Alaska Natives | 1.0 /100 | #242 | Tragic 10.4% |
| Nepalese | 0.8 /100 | #243 | Tragic 10.4% |
| Cree | 0.7 /100 | #244 | Tragic 10.5% |
| Immigrants | Burma/Myanmar | 0.6 /100 | #245 | Tragic 10.5% |
| Cherokee | 0.5 /100 | #246 | Tragic 10.6% |
| Liberians | 0.4 /100 | #247 | Tragic 10.6% |
| Nicaraguans | 0.4 /100 | #248 | Tragic 10.6% |
| Cubans | 0.4 /100 | #249 | Tragic 10.6% |
| Salvadorans | 0.3 /100 | #250 | Tragic 10.7% |
| Iroquois | 0.3 /100 | #251 | Tragic 10.7% |
| Immigrants | Zaire | 0.3 /100 | #252 | Tragic 10.7% |
Demographics Similar to Immigrants from Chile by Family Poverty
In terms of family poverty, the demographic groups most similar to Immigrants from Chile are Kenyan (8.9%, a difference of 0.19%), Lebanese (8.9%, a difference of 0.27%), Immigrants from Peru (8.9%, a difference of 0.29%), Israeli (8.9%, a difference of 0.35%), and Immigrants from Ethiopia (8.9%, a difference of 0.41%).
| Demographics | Rating | Rank | Family Poverty |
| Ethiopians | 66.3 /100 | #162 | Good 8.8% |
| Pennsylvania Germans | 66.0 /100 | #163 | Good 8.8% |
| Celtics | 64.9 /100 | #164 | Good 8.8% |
| Guamanians/Chamorros | 64.7 /100 | #165 | Good 8.8% |
| Afghans | 63.5 /100 | #166 | Good 8.8% |
| Immigrants | Ethiopia | 62.5 /100 | #167 | Good 8.9% |
| Israelis | 62.1 /100 | #168 | Good 8.9% |
| Immigrants | Chile | 59.6 /100 | #169 | Average 8.9% |
| Kenyans | 58.2 /100 | #170 | Average 8.9% |
| Lebanese | 57.6 /100 | #171 | Average 8.9% |
| Immigrants | Peru | 57.5 /100 | #172 | Average 8.9% |
| Immigrants | Fiji | 56.4 /100 | #173 | Average 8.9% |
| Immigrants | Albania | 50.0 /100 | #174 | Average 9.0% |
| Costa Ricans | 49.3 /100 | #175 | Average 9.0% |
| Immigrants | Syria | 47.5 /100 | #176 | Average 9.0% |