Immigrants from Bulgaria vs Immigrants from Scotland Seniors Poverty Over the Age of 65
COMPARE
Immigrants from Bulgaria
Immigrants from Scotland
Seniors Poverty Over the Age of 65
Seniors Poverty Over the Age of 65 Comparison
Immigrants from Bulgaria
Immigrants from Scotland
10.1%
SENIORS POVERTY OVER THE AGE OF 65
97.0/ 100
METRIC RATING
89th/ 347
METRIC RANK
9.3%
SENIORS POVERTY OVER THE AGE OF 65
99.9/ 100
METRIC RATING
26th/ 347
METRIC RANK
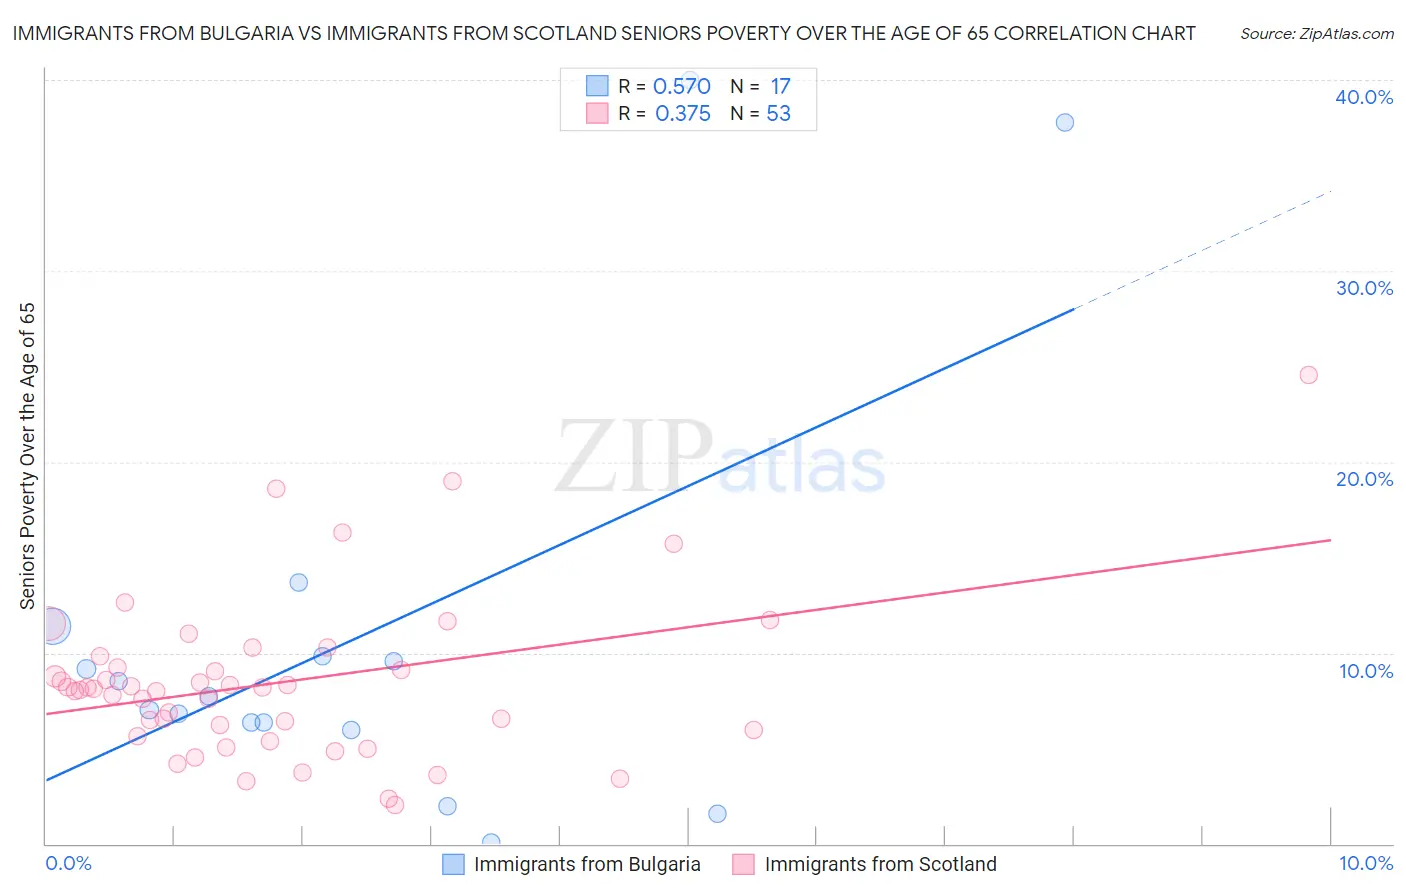
Immigrants from Bulgaria vs Immigrants from Scotland Seniors Poverty Over the Age of 65 Correlation Chart
The statistical analysis conducted on geographies consisting of 172,435,025 people shows a substantial positive correlation between the proportion of Immigrants from Bulgaria and poverty level among seniors over the age of 65 in the United States with a correlation coefficient (R) of 0.570 and weighted average of 10.1%. Similarly, the statistical analysis conducted on geographies consisting of 196,224,492 people shows a mild positive correlation between the proportion of Immigrants from Scotland and poverty level among seniors over the age of 65 in the United States with a correlation coefficient (R) of 0.375 and weighted average of 9.3%, a difference of 8.6%.
Seniors Poverty Over the Age of 65 Correlation Summary
| Measurement | Immigrants from Bulgaria | Immigrants from Scotland |
| Minimum | 0.093% | 2.0% |
| Maximum | 40.0% | 24.5% |
| Range | 39.9% | 22.5% |
| Mean | 10.8% | 8.4% |
| Median | 7.7% | 8.1% |
| Interquartile 25% (IQ1) | 6.1% | 5.8% |
| Interquartile 75% (IQ3) | 10.6% | 9.5% |
| Interquartile Range (IQR) | 4.5% | 3.7% |
| Standard Deviation (Sample) | 11.1% | 4.3% |
| Standard Deviation (Population) | 10.8% | 4.2% |
Similar Demographics by Seniors Poverty Over the Age of 65
Demographics Similar to Immigrants from Bulgaria by Seniors Poverty Over the Age of 65
In terms of seniors poverty over the age of 65, the demographic groups most similar to Immigrants from Bulgaria are Ukrainian (10.1%, a difference of 0.060%), Jordanian (10.1%, a difference of 0.080%), Puget Sound Salish (10.1%, a difference of 0.080%), Immigrants from Singapore (10.1%, a difference of 0.10%), and Burmese (10.1%, a difference of 0.13%).
| Demographics | Rating | Rank | Seniors Poverty Over the Age of 65 |
| Immigrants | Bolivia | 97.3 /100 | #82 | Exceptional 10.1% |
| Immigrants | Poland | 97.2 /100 | #83 | Exceptional 10.1% |
| Immigrants | Afghanistan | 97.2 /100 | #84 | Exceptional 10.1% |
| Immigrants | Nepal | 97.2 /100 | #85 | Exceptional 10.1% |
| Romanians | 97.2 /100 | #86 | Exceptional 10.1% |
| Burmese | 97.2 /100 | #87 | Exceptional 10.1% |
| Jordanians | 97.1 /100 | #88 | Exceptional 10.1% |
| Immigrants | Bulgaria | 97.0 /100 | #89 | Exceptional 10.1% |
| Ukrainians | 96.9 /100 | #90 | Exceptional 10.1% |
| Puget Sound Salish | 96.9 /100 | #91 | Exceptional 10.1% |
| Immigrants | Singapore | 96.9 /100 | #92 | Exceptional 10.1% |
| Immigrants | Sweden | 96.7 /100 | #93 | Exceptional 10.1% |
| Immigrants | Germany | 96.7 /100 | #94 | Exceptional 10.1% |
| Immigrants | Japan | 96.3 /100 | #95 | Exceptional 10.1% |
| Basques | 95.9 /100 | #96 | Exceptional 10.2% |
Demographics Similar to Immigrants from Scotland by Seniors Poverty Over the Age of 65
In terms of seniors poverty over the age of 65, the demographic groups most similar to Immigrants from Scotland are Irish (9.3%, a difference of 0.030%), Italian (9.3%, a difference of 0.080%), Tongan (9.3%, a difference of 0.27%), Bulgarian (9.3%, a difference of 0.30%), and Welsh (9.3%, a difference of 0.38%).
| Demographics | Rating | Rank | Seniors Poverty Over the Age of 65 |
| Swiss | 99.9 /100 | #19 | Exceptional 9.2% |
| Thais | 99.9 /100 | #20 | Exceptional 9.2% |
| Luxembourgers | 99.9 /100 | #21 | Exceptional 9.2% |
| Slovenes | 99.9 /100 | #22 | Exceptional 9.3% |
| Welsh | 99.9 /100 | #23 | Exceptional 9.3% |
| Bulgarians | 99.9 /100 | #24 | Exceptional 9.3% |
| Irish | 99.9 /100 | #25 | Exceptional 9.3% |
| Immigrants | Scotland | 99.9 /100 | #26 | Exceptional 9.3% |
| Italians | 99.9 /100 | #27 | Exceptional 9.3% |
| Tongans | 99.9 /100 | #28 | Exceptional 9.3% |
| Bhutanese | 99.9 /100 | #29 | Exceptional 9.3% |
| Menominee | 99.8 /100 | #30 | Exceptional 9.4% |
| Finns | 99.8 /100 | #31 | Exceptional 9.4% |
| Northern Europeans | 99.8 /100 | #32 | Exceptional 9.4% |
| Native Hawaiians | 99.8 /100 | #33 | Exceptional 9.4% |